Task E Print Exponential and Logarithmic Models In this activity, you will formulate and graph exponential and logarithmic functions and describe the relationship between the two functions. Oak wilt is a fungal disease that infects oak trees. Scientists have discovered that a single tree in a small forest is infected with oak wilt. They determined that they can use this exponential model to predict the number of trees in the forest that will be infected after t years. f (t) = e0.4t Part A 2 Question Graph the function f (t) = e0.4t. + MARK + RELATIONSHIP + DATA Y = abt O Best fit a: 0.2 -10 10 b: 1.7 10
Task E Print Exponential and Logarithmic Models In this activity, you will formulate and graph exponential and logarithmic functions and describe the relationship between the two functions. Oak wilt is a fungal disease that infects oak trees. Scientists have discovered that a single tree in a small forest is infected with oak wilt. They determined that they can use this exponential model to predict the number of trees in the forest that will be infected after t years. f (t) = e0.4t Part A 2 Question Graph the function f (t) = e0.4t. + MARK + RELATIONSHIP + DATA Y = abt O Best fit a: 0.2 -10 10 b: 1.7 10

Chapter6: Exponential And Logarithmic Functions
Section6.4: Graphs Of Logarithmic Functions
Problem 5SE: Does the graph of a general logarithmic functionhave a horizontal asymptote? Explain.

Related questions
Question
Graph the logarithmic function that models the number of years, g(x), for the number of infected trees to reach a value of x.
(Second photo is in case you need some more information)
Transcribed Image Text:Task
E Print
Exponential and Logarithmic Models
In this activity, you will formulate and graph exponential and logarithmic functions and describe the relationship between the
two functions.
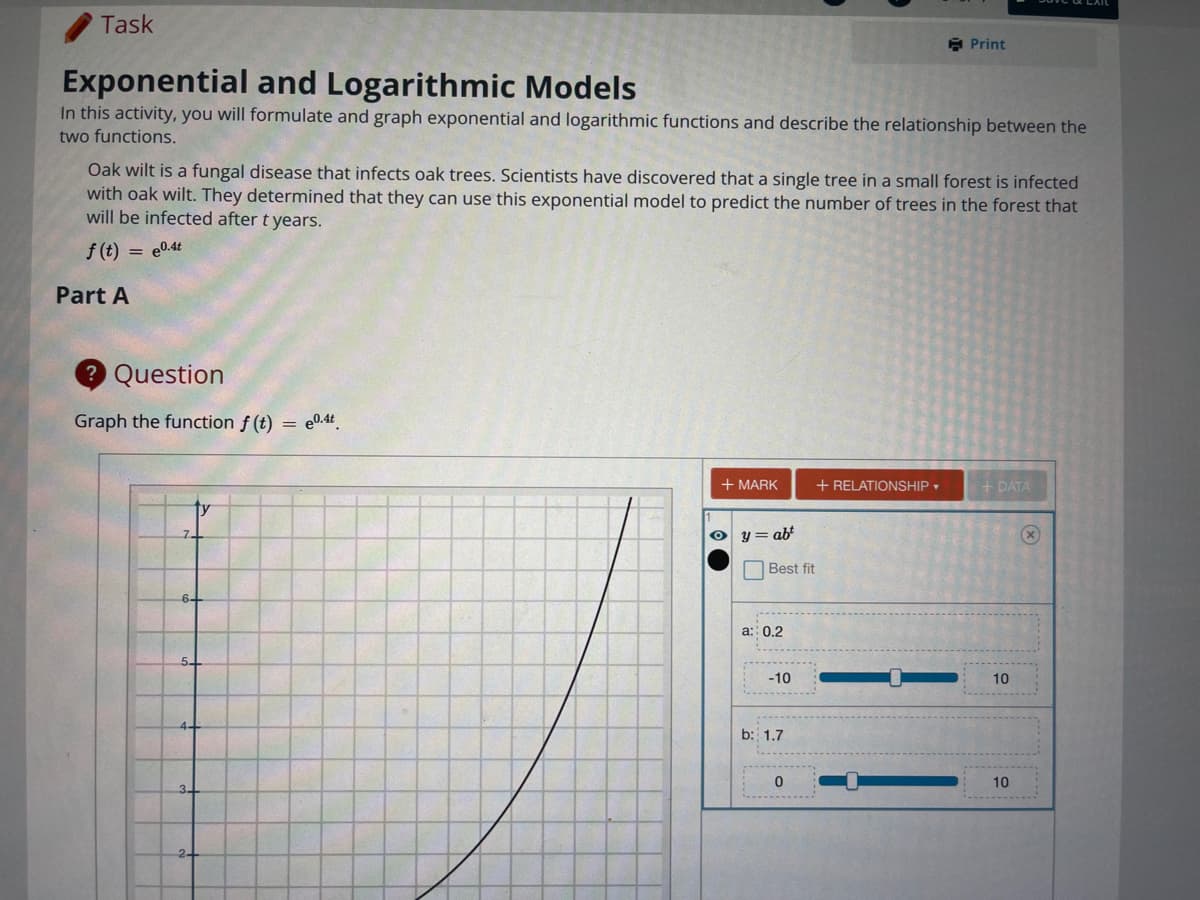
Oak wilt is a fungal disease that infects oak trees. Scientists have discovered that a single tree in a small forest is infected
with oak wilt. They determined that they can use this exponential model to predict the number of trees in the forest that
will be infected after t years.
f (t) = e0.4t
Part A
2 Question
Graph the function f (t)
= e0.4t
+ MARK
+ RELATIONSHIP
+ DATA
y = abt
O Best fit
a: 0.2
-10
10
b: 1.7
10

Transcribed Image Text:Part D
2 Question
Graph the logarithmic function that models the number of years, g(x), for the number of infected trees to reach a value
of x.
+ MARK
+ RELATIONSHIP
+ DATA
4ty
3
2-
2
(?
Expert Solution
This question has been solved!
Explore an expertly crafted, step-by-step solution for a thorough understanding of key concepts.

This is a popular solution!

Trending now
This is a popular solution!

Step by step
Solved in 3 steps with 1 images

Recommended textbooks for you

College Algebra
Algebra
ISBN:
9781305115545
Author:
James Stewart, Lothar Redlin, Saleem Watson
Publisher:
Cengage Learning

Functions and Change: A Modeling Approach to Coll…
Algebra
ISBN:
9781337111348
Author:
Bruce Crauder, Benny Evans, Alan Noell
Publisher:
Cengage Learning
College Algebra
Algebra
ISBN:
9781305115545
Author:
James Stewart, Lothar Redlin, Saleem Watson
Publisher:
Cengage Learning
Functions and Change: A Modeling Approach to Coll…
Algebra
ISBN:
9781337111348
Author:
Bruce Crauder, Benny Evans, Alan Noell
Publisher:
Cengage Learning

College Algebra (MindTap Course List)
Algebra
ISBN:
9781305652231
Author:
R. David Gustafson, Jeff Hughes
Publisher:
Cengage Learning

Algebra & Trigonometry with Analytic Geometry
Algebra
ISBN:
9781133382119
Author:
Swokowski
Publisher:
Cengage

Big Ideas Math A Bridge To Success Algebra 1: Stu…
Algebra
ISBN:
9781680331141
Author:
HOUGHTON MIFFLIN HARCOURT
Publisher:
Houghton Mifflin Harcourt