Tax Revenue and Marginal Tax Rates: Laffer Curve 31. The Laffer Curve is a critical component in the theory of Supply Side Economics. 32. Starting with President Regan, in 1980 the argument was that marginal tax rates were too high. So lowering the tax rate would raise total government tax revenue. 33. The second key concept is that If you cut business taxes it would create a wave of Investment spending. 34. Thus, shifting out the PPF would increase average income for all households. Why? The Laffer Curve 35. Thus, cutting taxes for the corporations and the wealthy will create a "trickle down effect." 36. Empirical economic evidence Indicates that: 37. During Reagan's presidency, the national debt grew from $997 billon to $2.85 trillion. 38. This led to the U.S. moving from the world's largest international creditor to the world's largest debtor nation (U.S. Dept. Treasury). 39. As polnted out in slide 12 on Income distribution, the 60% of American households have experienced a continual decline in share of national Income since 1980. 0% 100% 40. What about the Current Tax Cut? Tax Rate 6:12/ 6:50 YouTube CC The Laffer Curve theorizes that the level of marginal U.S. tax rates effect the level of Select one: a. U.S. poverty rate b. level of income inequality in the U.S. C. government tax revenues collected d. the level of household spending
Tax Revenue and Marginal Tax Rates: Laffer Curve 31. The Laffer Curve is a critical component in the theory of Supply Side Economics. 32. Starting with President Regan, in 1980 the argument was that marginal tax rates were too high. So lowering the tax rate would raise total government tax revenue. 33. The second key concept is that If you cut business taxes it would create a wave of Investment spending. 34. Thus, shifting out the PPF would increase average income for all households. Why? The Laffer Curve 35. Thus, cutting taxes for the corporations and the wealthy will create a "trickle down effect." 36. Empirical economic evidence Indicates that: 37. During Reagan's presidency, the national debt grew from $997 billon to $2.85 trillion. 38. This led to the U.S. moving from the world's largest international creditor to the world's largest debtor nation (U.S. Dept. Treasury). 39. As polnted out in slide 12 on Income distribution, the 60% of American households have experienced a continual decline in share of national Income since 1980. 0% 100% 40. What about the Current Tax Cut? Tax Rate 6:12/ 6:50 YouTube CC The Laffer Curve theorizes that the level of marginal U.S. tax rates effect the level of Select one: a. U.S. poverty rate b. level of income inequality in the U.S. C. government tax revenues collected d. the level of household spending

Chapter16: The Public Sector
Section16.4: Public Choice Theory
Problem 1YTE

Related questions
Question
Transcribed Image Text:Tax Revenue and Marginal Tax Rates: Laffer Curve
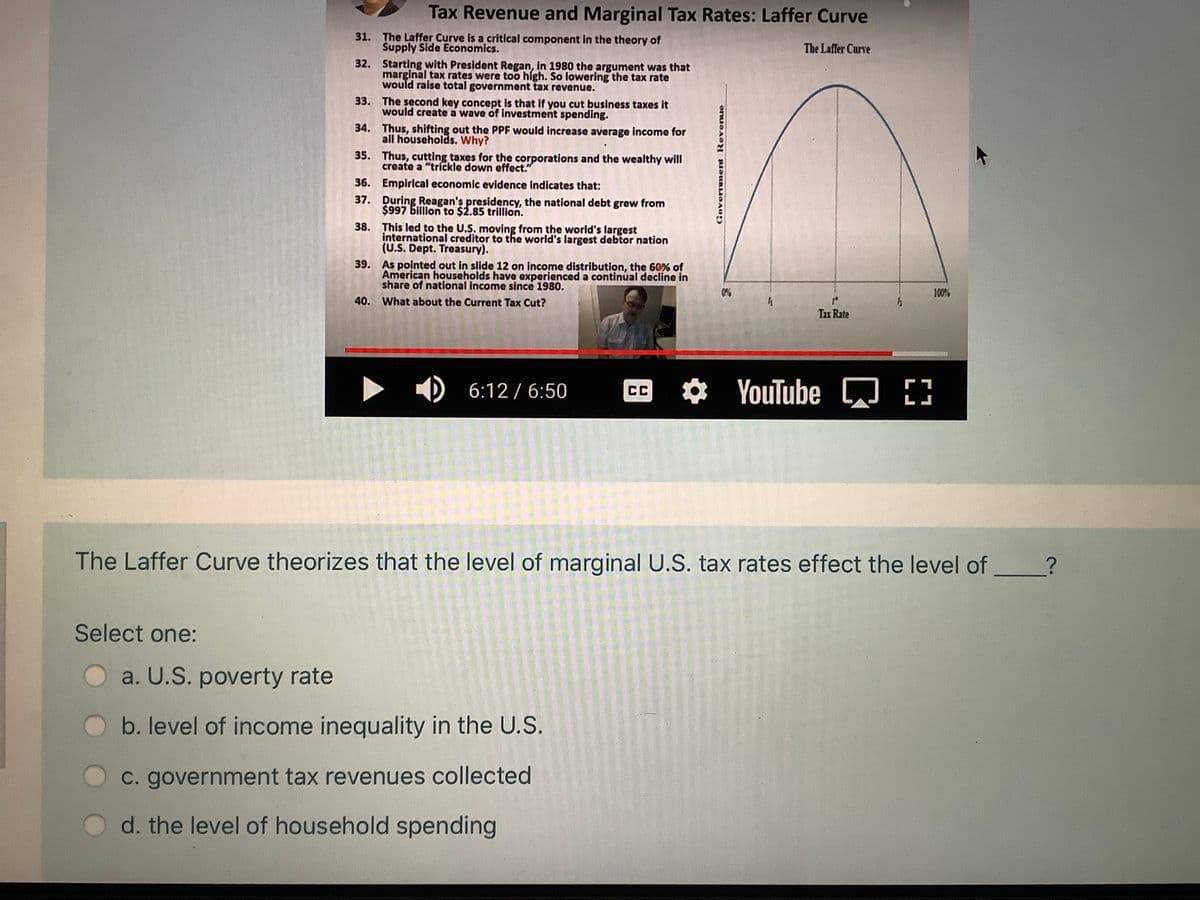
31. The Laffer Curve is a critical component in the theory of
Supply Side Economics.
32. Starting with President Regan, in 1980 the argument was that
marginal tax rates were too high. So lowering the tax rate
would raise total government tax revenue.
The Laffer Curve
33. The second key concept is that if you cut business taxes it
would create a wave of investment spending.
34. Thus, shifting out the PPF would increase average income for
all households. Why?
35. Thus, cutting taxes for the corporations and the wealthy will
create a "trickle down effect."
36. Empirical economic evidence indicates that:
37. During Reagan's presidency, the national debt grew from
$997 billion to $2.85 trillion.
38. This led to the U.S. moving from the world's largest
international creditor to the world's largest debtor nation
(U.S. Dept. Treasury).
39. As pointed out in slide 12 on income distribution, the 60% of
American households have experienced a continual decline in
share of national income since 1980.
0%
100%
40. What about the Current Tax Cut?
Tax Rate
D 6:12 / 6:50
CC YouTube
[)
LJ
The Laffer Curve theorizes that the level of marginal U.S. tax rates effect the level of
Select one:
a. U.S. poverty rate
b. level of income inequality in the U.S.
C. government tax revenues collected
d. the level of household spending
Government Revenue
Expert Solution
This question has been solved!
Explore an expertly crafted, step-by-step solution for a thorough understanding of key concepts.

This is a popular solution!

Trending now
This is a popular solution!

Step by step
Solved in 2 steps

Knowledge Booster


Learn more about
Need a deep-dive on the concept behind this application? Look no further. Learn more about this topic, economics and related others by exploring similar questions and additional content below.Recommended textbooks for you

Economics (MindTap Course List)
Economics
ISBN:
9781337617383
Author:
Roger A. Arnold
Publisher:
Cengage Learning

Economics (MindTap Course List)
Economics
ISBN:
9781337617383
Author:
Roger A. Arnold
Publisher:
Cengage Learning