ted using temperature parts is also tested using a high temperature level. The random variable of interest is the shrinkage that occurred in the units, measured in percentage. Assume that the data sets follow the normal distribution. The results are as follows: Low Temperature High Temperature 21.2 20.9 19.8 17.9 17.6 18.3 15.9 16.5 17.8 16.1 20.3 20.5 21.3 20.8 19.7 18.7 16.4 172 S- 0.9709 21.5 20.3
ted using temperature parts is also tested using a high temperature level. The random variable of interest is the shrinkage that occurred in the units, measured in percentage. Assume that the data sets follow the normal distribution. The results are as follows: Low Temperature High Temperature 21.2 20.9 19.8 17.9 17.6 18.3 15.9 16.5 17.8 16.1 20.3 20.5 21.3 20.8 19.7 18.7 16.4 172 S- 0.9709 21.5 20.3

Glencoe Algebra 1, Student Edition, 9780079039897, 0079039898, 2018
18th Edition
ISBN:9780079039897
Author:Carter
Publisher:Carter
Chapter10: Statistics
Section10.4: Distributions Of Data
Problem 19PFA

Related questions
Question
please reply, no matter if it takes a long time
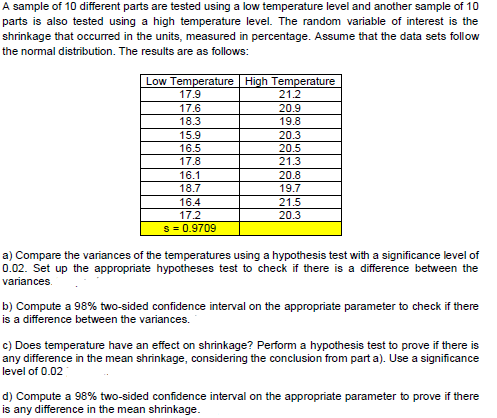
Transcribed Image Text:A sample of 10 different parts are tested using a low temperature level and another sample of 10
parts is also tested using a high temperature level. The random variable of interest is the
shrinkage that occurred in the units, measured in percentage. Assume that the data sets follow
the normal distribution. The results are as follows:
Low Temperature High Temperature
17.9
21.2
17.6
20.9
18.3
19.8
15.9
16.5
17.8
20.3
20.5
21.3
16.1
20.8
18.7
19.7
16.4
21.5
17.2
20.3
s = 0.9709
a) Compare the variances of the temperatures using a hypothesis test with a significance level of
0.02. Set up the appropriate hypotheses test to check if there is a difference between the
variances.
b) Compute a 98% two-sided confidence interval on the appropriate parameter to check if there
is a difference between the variances.
c) Does temperature have an effect on shrinkage? Perform a hypothesis test to prove if there is
any difference in the mean shrinkage, considering the conclusion from part a). Use a significance
level of 0.02
d) Compute a 98% two-sided confidence interval on the appropriate parameter to prove if there
is any difference in the mean shrinkage.
Expert Solution
This question has been solved!
Explore an expertly crafted, step-by-step solution for a thorough understanding of key concepts.

Step by step
Solved in 5 steps with 13 images

Recommended textbooks for you
Glencoe Algebra 1, Student Edition, 9780079039897…
Algebra
ISBN:
9780079039897
Author:
Carter
Publisher:
McGraw Hill
Glencoe Algebra 1, Student Edition, 9780079039897…
Algebra
ISBN:
9780079039897
Author:
Carter
Publisher:
McGraw Hill