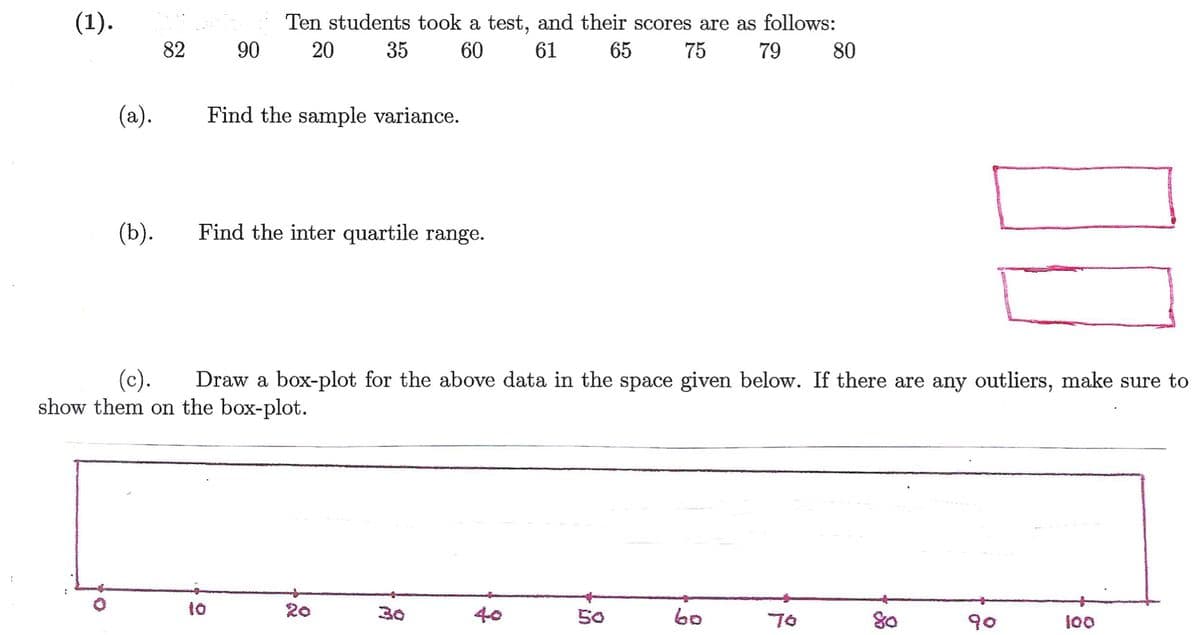
Ten students took a test, and their scores are as follows: 20 82 90 35 60 61 65 75 79 80 (a). Find the sample variance. (b). Find the inter quartile range. (c). v them on the box-plot. Draw a box-plot for the above data in the space given below. If there are any outliers, make sure t to 20 30 40 50
Ten students took a test, and their scores are as follows: 20 82 90 35 60 61 65 75 79 80 (a). Find the sample variance. (b). Find the inter quartile range. (c). v them on the box-plot. Draw a box-plot for the above data in the space given below. If there are any outliers, make sure t to 20 30 40 50

Glencoe Algebra 1, Student Edition, 9780079039897, 0079039898, 2018
18th Edition
ISBN:9780079039897
Author:Carter
Publisher:Carter
Chapter10: Statistics
Section10.4: Distributions Of Data
Problem 19PFA

Related questions
Question
Transcribed Image Text:(1).
Ten students took a test, and their scores are as follows:
82
90
20
35
60
61
65
75
79
80
(a).
Find the sample variance.
(b).
Find the inter quartile range.
(c).
show them on the box-plot.
Draw a box-plot for the above data in the space given below. If there are any outliers, make sure to
:
to
20
30
40
50
80
70
90
100
Expert Solution
This question has been solved!
Explore an expertly crafted, step-by-step solution for a thorough understanding of key concepts.

Step by step
Solved in 4 steps with 1 images

Recommended textbooks for you
Glencoe Algebra 1, Student Edition, 9780079039897…
Algebra
ISBN:
9780079039897
Author:
Carter
Publisher:
McGraw Hill
Glencoe Algebra 1, Student Edition, 9780079039897…
Algebra
ISBN:
9780079039897
Author:
Carter
Publisher:
McGraw Hill