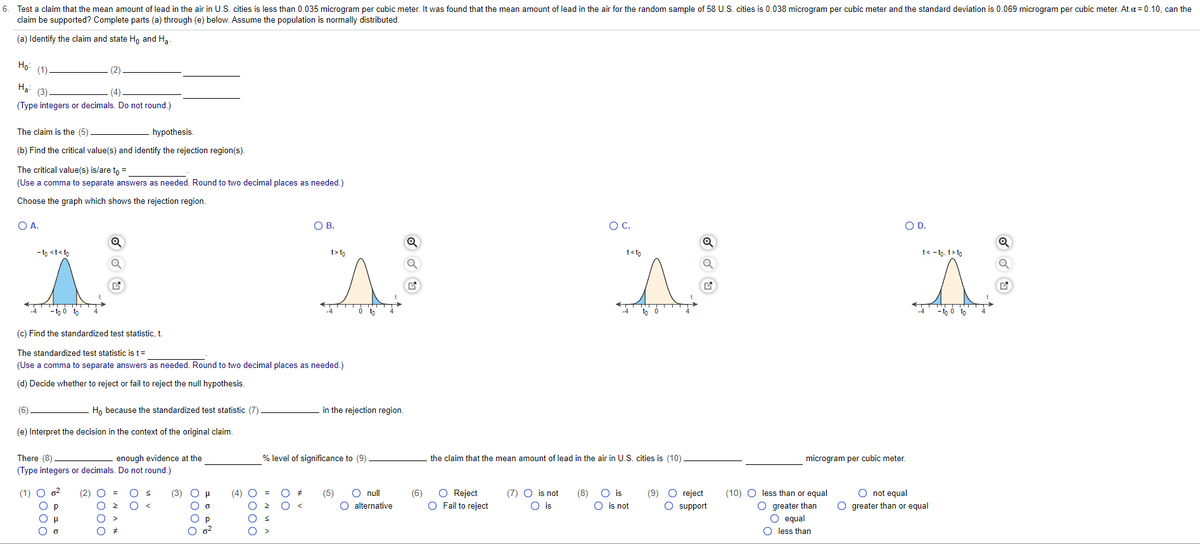
Test a claim that the mean amount of lead in the air in U.S. cities is less than 0.035 microgram per cubic meter. It was found that the mean amount of lead in the air for the random sample of 58 U.S. cities is 0.038 microgram per cubic meter and the standard deviation is 0.069 microgram per cubic meter. claim be supported? Complete parts (a) through (e) below. Assume the population is normally distributed. (a) Identify the claim and state Hg and H, (1). (2) H. (3)- (Type integers or decimals. Do not round.) The claim is the (5) hypothesis. (b) Find the critical value(s) and identify the rejection regionis). The critical value(s) islare to = (Use a comma to separate answers as needed. Round to two decimal places as needed) Choose the graph which shows the rejection region. OA. OB. Oc. c. OD. t<- t (c) Find the standardized test statistic, t The standardized test statistic is t= (Use a comma to separate answers as needed. Round to two decimal places as needed.) (d) Decide whether to reject or fail to reject the null hypothesis . (6) H, because the standardized test statistic (7) - -in the rejection region. (e) Interpret the decision in the context of the original claim. There (8). enough evidence at the % level of significance to (9). the claim that the mean amount of lead in the air in U.S. cities is (10). microgram per cubic meter. (Type integers or decimals. Do not round.)


Continuous Probability Distributions
Probability distributions are of two types, which are continuous probability distributions and discrete probability distributions. A continuous probability distribution contains an infinite number of values. For example, if time is infinite: you could count from 0 to a trillion seconds, billion seconds, so on indefinitely. A discrete probability distribution consists of only a countable set of possible values.
Normal Distribution
Suppose we had to design a bathroom weighing scale, how would we decide what should be the range of the weighing machine? Would we take the highest recorded human weight in history and use that as the upper limit for our weighing scale? This may not be a great idea as the sensitivity of the scale would get reduced if the range is too large. At the same time, if we keep the upper limit too low, it may not be usable for a large percentage of the population!


Trending now
This is a popular solution!

Step by step
Solved in 2 steps


