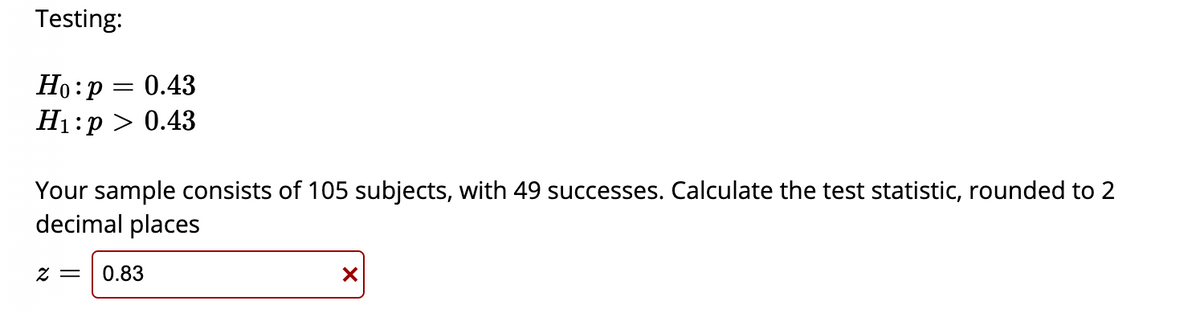
Testing: Ho:p = 0.43 H1:p > 0.43 Your sample consists of 105 subjects, with 49 successes. Calculate the test statistic, rounded to 2 decimal places 2 = 0.83


Q: The probability that fewer than 245 people voted for the referendum is
A: p = 0.52 n = 500
Q: esting: H0:p=0.32 H1:p>0.32 Your sample consists of 147 subjects, with 55 successe
A: The sample proportion can be calculated as: Calculate the z test statistic as follows: Substitute…
Q: Testing: H0:p=0.52H0:p=0.52 H1:p>0.52H1:p>0.52 Your sample consists of 101 subjects, with 55…
A:
Q: Testing: Ho:p = 0.84 H1:p > 0.84 Your sample consists of 111 subjects, with 91 successes. Calculate…
A:
Q: Calculate the test statistic,
A: Given that Null hypothesis H0 : P=0.34 Alternative hypothesis H1 : P>0.34 Sample size (n) = 122…
Q: H0:p=0.5 H1:p<0.5 Your sample consists of 131 subjects, with 72 successes. Calculate the test…
A:
Q: H0:p=0.82 H1:p≠0.82 Your sample consists of 110 subjects, with 85 successes. Calculate the test…
A:
Q: What is the observed z/t score?
A: Given that Sample size (n) = 35 Sample mean = 41 Population mean = 40 Population standard deviation…
Q: Testing: H0:p=0.95H0:p=0.95 H1:p>0.95H1:p>0.95 Your sample consists of 87 subjects, with 79…
A:
Q: Attempt 3 In a study of exhaust emissions from school buses, the pollution intake by passengers was…
A:
Q: Testing:H0:p=0.72H1:p>0.72 Your sample consists of 147 subjects, with 100 successes. Calculate…
A:
Q: Testing: Ho:p = 0.94 H1:p > 0.94 Your sample consists of 107 subjects, with 98 successes. Calculate…
A: We have given that, Hypothesized Population proportion >= 0.94 And favorable cases (X) = 98…
Q: Testing: H0:p=0.78H0:p=0.78 H1:p<0.78H1:p<0.78 Your sample consists of 121 subjects, with 98…
A: Solution: State the hypotheses. Null hypothesis: H0: p=0.78 Alternative hypothesis: H1: p<0.78
Q: Test the claim that the proportion of men who own cats is smaller than the proportion of women who…
A:
Q: Testing: H0:p ≤ 0.35 HA:p > 0.35 Your sample consists of 148 subjects, with 59 successes.…
A: GivenH0:p≤0.35Ha:p>0.35sample size(n)=148x=59
Q: Testing: H0:p=0.66H0:p=0.66 H1:p≠0.66H1:p≠0.66 Your sample consists of 147 subjects, with 93…
A: Given, The sample proportion is,
Q: Nutrition The mean ±1 sd of ln [calcium intake (mg)] among 25 females, 12 to 14 years of age, below…
A: The data for two groups of females were given and they are independent of each other.
Q: Researchers are interested in estimating the prevalence of the HPV vaccine among young women aged…
A: The population proportion, P = 0.23. From the given information, out of the 67 women, 24 have…
Q: Testing: H0:p=0.56H0:p=0.56 H1:p≠0.56H1:p≠0.56 Your sample consists of 67 subjects, with 34…
A: Given, Sample size n=67 No.of successes X=34 Sample proportion P∧=Xn…
Q: Number of computer encoders with scores greater than 75 Percentage of computer encoders with scores…
A: Number of computer encoders with scores greater than 75 is = 17+14+4+2+3 = 40 Scores less than 85=…
Q: H0:p=0.89 H1:p>0.89 Your sample consists of 61 subjects, with 55 successes. Calculate the test…
A:
Q: Solve it in Excel and walk through the process step by step to illustrate how it's done. Also, for…
A: Given information: Top Bottom 26.3 26.22 26.43 26.32 26.28 26.2 26.19 26.11 26.49…
Q: Madison County has a population of 34,522 people. The county hospital is interested in estimating…
A: Given Data: p=22/527 n=34522
Q: Testing: H0:p=0.76H0:p=0.76 H1:p≠0.76H1:p≠0.76 Your sample consists of 77 subjects, with 60…
A: From the provided information, Sample size (n) = 77 Number of successes (x) = 60
Q: c) Find the test statistic, round answer to at least 3 decimal places. d) What is the p-value? Round…
A: Solution : See the excel output find the Observed counts and Expected counts see in excel sheet
Q: Lengths of pregnancies of humans are N(268 days, 16 days). Use the Empirical Rule to determine the…
A: The percentage of women whose pregnancies are between 252 and 284 days is obtained below:It is given…
Q: Testing: Но: р — 0.81 H1:p + 0.81 Your sample consists of 116 subjects, with 93 successes. Calculate…
A: Let us assume p be the population proportion of a certain characteristic. Let n is the sample size…
Q: Testing: H0:p=0.7H0:p=0.7 H1:p≠0.7H1:p≠0.7 Your sample consists of 98 subjects, with 70 successes.…
A: Given: H0:p=0.7H1:p≠0.7 Number of sample space, N=98 Number of success, s=70 The probability of…
Q: Testing: Ho: p = 0.62 H₁:p 0.62 Your sample consists of 119 subjects, with 71 successes. Calculate…
A: From the provided information, Sample size (n) = 119 From which 71 got successes. The hypotheses are…
Q: 3. A psychologist theorized that people could hear better when they have just eaten a large meal.…
A: Two sample t-test:Two sample t-test is used to test the difference between two population means. A…
Q: Testing: Ho:p = 0.28 H1:p > 0.28 Your sample consists of 103 subjects, with 34 successes. Calculate…
A:
Q: Studying for the test (Part 2): Using the results from the 12 Calculate the difference in mean score…
A: Given,mean score for outline =87.9mean score for no outline=80.4
Q: n a recent year, the Better Business Bureau settled 75% of complaints they received. (Source: USA…
A: Central limit theorem: For a simple random sample of size n drawn from a population, the sampling…
Q: H0:p=0.74H1:p>0.74Your sample consists of 122 subjects, with 93 successes. Calculate the test…
A: Given data ,n=122x=93Sample Proportion P=xn =93122…
Q: Testing: Ho:p = 0.85 H1:p + 0.85 Your sample consists of 102 subjects, with 87 successes. Calculate…
A: Given that: X represents success. X= 87 Sample size (n) = 102 Sample size is greater than 30 , so…
Q: Testing: H0:p=0.68H0:p=0.68 H1:p<0.68H1:p<0.68 Your sample consists of 137 subjects, with 95…
A:
Q: Testing: H0:p=0.42 H1:p<0.42 Your sample consists of 126 subjects, with 52 successes. Calculate…
A:
Q: Prof. Leen wants to estimate the more than 92% percent of adults living in a large city have cell…
A:
Q: A scale measuring confidence in the media was administered to a sample. Is there a statistically…
A: Perform the two sample t-test using the sample data. Null hypothesis: H0: μ1=μ2Alternative…
Q: Exit polling is a popular technique used to determine the outcome of an election prior to results…
A: Obtain the probability that fewer than 98 people voted for the referendum. The probability that…
Q: Exit polling is a popular technique used to determine the outcome of an election prior to results…
A:
Q: Testing: H0:p=0.69H0:p=0.69 H1:p≠0.69H1:p≠0.69 Your sample consists of 144 subjects, with 94…
A: State the hypotheses.
Q: Find the value of the test statistic. The claim is that the proportion of drowning deaths of…
A: From the given information, The claim is that the proportion of drowning deaths of children…
Q: Testing: H0:p=0.56 H1:p≠0.56 Your sample consists of 73 subjects, with 38 successes. Calculate the…
A: We have given that, The number of success X=38 and sample size n=73 then, => Sample proportion…
Q: Testing: H0:p=0.89H0:p=0.89 H1:p<0.89H1:p<0.89 Your sample consists of 110 subjects, with 95…
A: Solution: State the hypotheses. Null hypothesis: H0: p=0.89 Alternative hypothesis: H1: p<0.89
Q: Testing: H0:p=0.6 H1:p≠0.6 Your sample consists of 142 subjects, with 78 successes. Calculate the…
A: Hypotheses: The null and the alternative hypotheses are, H0: p=0.6 H1: p≠0.6
Q: Testing: Ho:p= 0.62 H1:p < 0.62 Your sample consists of 137 subjects, with 88 successes, Calculate…
A: Given data number of success , x= 88 sample size, n =137
Q: z Test for Proportions An automobile owner found that 20 years ago, 76% of Americans said that they…
A: Given n=56 X=38
Keep getting it wrong.


Trending now
This is a popular solution!

Step by step
Solved in 2 steps with 4 images


- Seat Designs. In Exercises 13–20, use the data in the table below for sitting adult males and females (based on anthropometric survey data from Gordon, Churchill, et al.). These data are used often in the design of different seats, including aircraft seats, train seats, theater seats, and classroom seats. (Hint: Draw a graph in each case.) Sitting Back-to-Knee Length (inches) For females, find the first quartile q1 , which is the length separating the bottom 25% from the top 75%.What statistical test would be most appropriate if you were interested in seeing how religiosity changes in early adulthood? Religiosity was measured using an interval scale, and the same participants provided data at two time points – at age 15 and 25. Assume the data meets all assumptions for a parametric testTwo Factor ANOVA How do i fill in the missing values on the chart and find out if the interaction is significant?
- At what age do babies learn to crawl? Does it take longer to learn in the winter when babies are often bundled in clothes that restrict their movement? Data were collected from parents who brought their babies into the University of Denver Infant Study Center to participate in one of a number of experiments between 1988 and 1991. Parents reported the birth month and the age at which their child was first able to creep or crawl a distance of four feet within one minute. The resulting data were grouped by month of birth. The data are for January, May, and September AverageBirth month crawling age SD nJanuary 29.84 7.08 32May 28.58 8.07 27September 33.83 6.93 38 Crawling age is given in weeks. Assume the data come from three independent simple random samples, one from each of the three populations (babies born in a particular month) and that the populations of crawling ages have normal…Regression and Predictions. Exercises 13–28 use the same data sets as Exercises 13–28 in Section 10-1. In each case, find the regression equation, letting the first variable be the predictor (x) variable. Find the indicated predicted value by following the prediction procedure summarized in Figure 10-5 on page 493. CPI and the Subway Use the CPI/subway fare data from the preceding exercise and find the best predicted subway fare for a time when the CPI reaches 500. What is wrong with this prediction?Graduation, part V The college administrators in Exer-cise 1 constructed a 95% confidence interval for the slope of their regression line. Interpret the meaning of theirinterval (-0.299%, -0.203%) within the context of theproblem.
- 18)The regression equation is intended to be the “best fitting” straight line for a set of data. Whatis the criterion for “best fitting”?Could you help me with this, please? & could you provide more details for me? thank you so much! One general belief held by observers of the business world is that taller men earn more money than shorter men. In a study reported in the Wall Street Journal, 30 MBA graduates, all about 30 years old, were surveyed and asked to report their annual incomes and their heights. These responses are recorded in MBA.xlsx. d Obtain three measures to check the fitness of the model. Do you think that this model is good enough to be used to estimate and predict income on the basis of height? If not, explain why not. If so, i predict the income of 183cm tall men with MBAs. ii estimate with 95% confidence the mean income of all 183 cm tall men with MBAs iii predict with 95% confidence the income of a 183 cm tall man with an MBA. Height Income ($) 175.0 68660 167.5 74820 172.5 69260 175.0 79620 162.5 69180 182.5 66700 160.0 71140 175.0 83680 172.5 70060…Conduct a simple linear regression to investigate whether a student’s support for scientific inquiry (PV1SUPP) predicts their performance in science (PV1SCIE). What was the outcome of this test? Explain using evidence from the R output.
- Exercise 1 – Chi-Square Goodness of Fit Test A recent study in a national business journal asked consumers the following question: “In general, how would you rate the level of service provided by your supermarket?” A district manager of Piggly Wiggly supermarkets asked the same question about Piggly Wiggly supermarkets in her district. She took a random sample of 525 Piggly Wiggly shoppers. The question she seeks to answer is: Do the results of the Piggly Wiggly survey contradict the national study using a 5 percent significance level? # 1: Test Set-Up This table shows the result of the Piggly Wiggly survey along with consumers’ ratings of supermarkets from the national study. Find the expected frequencies Table 15: Expected Frequencies (Note: Expected frequencies have been rounded off to a whole number.) # 2: Select the Significance Level, α A 5 percent significance level has been selected # 3: State the Null and Alternate Hypotheses H0: H1: Follow the examples shown in…Draw a scatter diagram for the above data Obtain the regression equation by using least square method Predict the price of a house with a size of 28 square feetThe table below presents the results of the test. 1) the researchers decide to use a 70-ms cutoff and obtain following tmredults: TP = 17, FP = 15, FN = 24, TN = 44. calculate the following values: a) sensitivity b) specificity c) PV (+) d) PV (-) 2) how did changing the cut-point affect the accuracy of the test?
