that empty homes are not as appealing to buyers as staged homes and, therefore, sell for lower prices than 150,000 – 175,000 22,0002 35,0002 5 The P-value is between staged homes. The mean selling price of the 5 empty 5 homes was $150,000 with a standard deviation of $22,000. The mean selling price of the 5 staged homes was $175,000 with a standard deviation of 0.10 and 0.15. 150,000 – 175,000 35,000. A dotplot of each sample shows no strong The P-value is between 22,0002 35,0002 5 5 skewness and no outliers. 0.20 and 0.30. 150,000 – 175,000 The P-value is between 22,0002 35,0002 5 5 0.10 and 0.15. 150,000 – 175,000 The P-value is between 22,0002 35,000² 5 5 0.20 and 0.30.
that empty homes are not as appealing to buyers as staged homes and, therefore, sell for lower prices than 150,000 – 175,000 22,0002 35,0002 5 The P-value is between staged homes. The mean selling price of the 5 empty 5 homes was $150,000 with a standard deviation of $22,000. The mean selling price of the 5 staged homes was $175,000 with a standard deviation of 0.10 and 0.15. 150,000 – 175,000 35,000. A dotplot of each sample shows no strong The P-value is between 22,0002 35,0002 5 5 skewness and no outliers. 0.20 and 0.30. 150,000 – 175,000 The P-value is between 22,0002 35,0002 5 5 0.10 and 0.15. 150,000 – 175,000 The P-value is between 22,0002 35,000² 5 5 0.20 and 0.30.

Glencoe Algebra 1, Student Edition, 9780079039897, 0079039898, 2018
18th Edition
ISBN:9780079039897
Author:Carter
Publisher:Carter
Chapter10: Statistics
Section10.6: Summarizing Categorical Data
Problem 23PPS

Related questions
Question
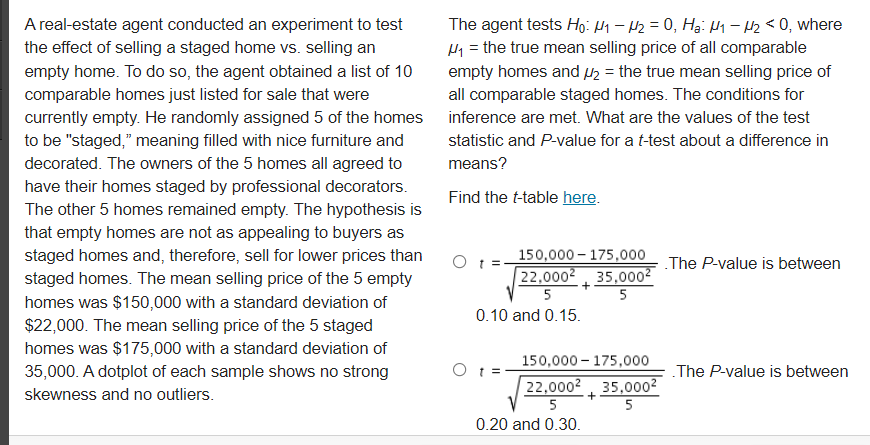
Transcribed Image Text:The agent tests Họ: H1- H2 = 0, Hạ: Hi - H2 < 0, where
H1 = the true mean selling price of all comparable
A real-estate agent conducted an experiment to test
the effect of selling a staged home vs. selling an
empty home. To do so, the agent obtained a list of 10
empty homes and pz = the true mean selling price of
comparable homes just listed for sale that were
all comparable staged homes. The conditions for
currently empty. He randomly assigned 5 of the homes inference are met. What are the values of the test
to be "staged," meaning filled with nice furniture and
statistic and P-value for a t-test about a difference in
decorated. The owners of the 5 homes all agreed to
means?
have their homes staged by professional decorators.
The other 5 homes remained empty. The hypothesis is
Find the t-table here.
that empty homes are not as appealing to buyers as
staged homes and, therefore, sell for lower prices than
150,000 - 175,000
O t=-
22,0002, 35,0002
5
The P-value is between
staged homes. The mean selling price of the 5 empty
5
homes was $150,000 with a standard deviation of
$22,000. The mean selling price of the 5 staged
homes was $175,000 with a standard deviation of
0.10 and 0.15.
150,000 – 175,000
35,000. A dotplot of each sample shows no strong
The P-value is between
22,0002 35,000?
5
skewness and no outliers.
+
5
0.20 and 0.30.
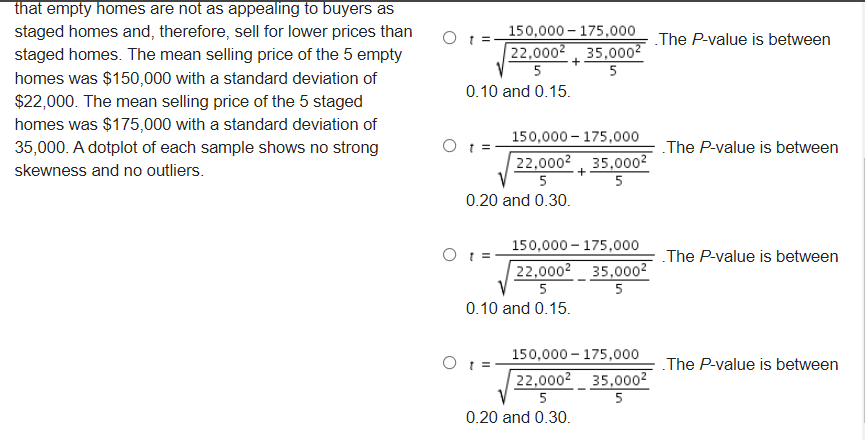
Transcribed Image Text:that empty homes are not as appealing to buyers as
staged homes and, therefore, sell for lower prices than
150,000 – 175,000
The P-value is between
22,0002 35,0002
5
5
staged homes. The mean selling price of the 5 empty
homes was $150,000 with a standard deviation of
$22,000. The mean selling price of the 5 staged
homes was $175,000 with a standard deviation of
0.10 and 0.15.
150,000 – 175,000
35,000. A dotplot of each sample shows no strong
The P-value is between
| 22,0002 35,0002
5
skewness and no outliers.
0.20 and 0.30.
150,000 - 175,000
The P-value is between
22,0002 35,0002
5
5
0.10 and 0.15.
150,000 – 175,000
O t =
The P-value is between
22,0002 35,000²
5
5
0.20 and 0.30.
Expert Solution
This question has been solved!
Explore an expertly crafted, step-by-step solution for a thorough understanding of key concepts.

Step by step
Solved in 2 steps with 1 images

Recommended textbooks for you
Glencoe Algebra 1, Student Edition, 9780079039897…
Algebra
ISBN:
9780079039897
Author:
Carter
Publisher:
McGraw Hill

Big Ideas Math A Bridge To Success Algebra 1: Stu…
Algebra
ISBN:
9781680331141
Author:
HOUGHTON MIFFLIN HARCOURT
Publisher:
Houghton Mifflin Harcourt

Holt Mcdougal Larson Pre-algebra: Student Edition…
Algebra
ISBN:
9780547587776
Author:
HOLT MCDOUGAL
Publisher:
HOLT MCDOUGAL
Glencoe Algebra 1, Student Edition, 9780079039897…
Algebra
ISBN:
9780079039897
Author:
Carter
Publisher:
McGraw Hill
Big Ideas Math A Bridge To Success Algebra 1: Stu…
Algebra
ISBN:
9781680331141
Author:
HOUGHTON MIFFLIN HARCOURT
Publisher:
Houghton Mifflin Harcourt
Holt Mcdougal Larson Pre-algebra: Student Edition…
Algebra
ISBN:
9780547587776
Author:
HOLT MCDOUGAL
Publisher:
HOLT MCDOUGAL