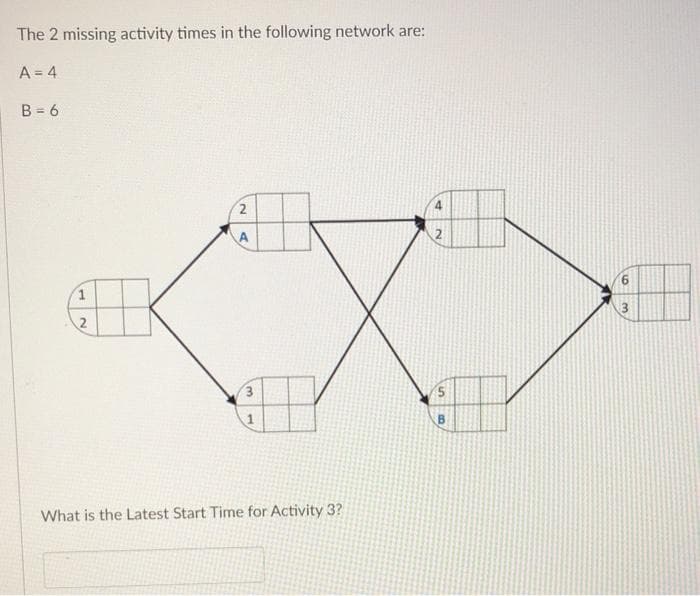
The 2 missing activity times in the following network are: A = 4 B = 6 2. A 1. 3. B What is the Latest Start Time for Activity 3?


Q: Use the following cell phone airport data speeds (Mbps) from a particular network. Find Q3. 0.3…
A: Solution: The data of cell phone airport data speeds (Mbps) from a particular network is given. The…
Q: 2. The table below shows the activities involved in a project and their immediate predecessors.…
A: We will draw the network depending upon the project activity in the next step
Q: Use the following cell phone airport data speeds (Mbps) from a particular network. Find P10- 0.1 0.1…
A: It is given that the 50 cell phone airport data speeds in an ascending order.
Q: 2.28 The following data give the number of turnovers (fumbles and interceptions) by a ecollege…
A: The single-value classes means each class has one observation only. The frequency is the number of…
Q: Use the following cell phone airport data speeds (Mbps) from a particular network. Find P50. 0.1…
A: Given information: 0.1, 0.2, 0.2, 0.2, 0.2, 0.3, 0.4, 0.4, 0.5, 0.6, 0.6, 0.6, 0.6, 0.6, 0.7, 0.7,…
Q: Draw the network using switches: C (AD + B).
A:
Q: Determine whether each of the following situations describes a positive association, a negative…
A: Higher concentrations of aragonite in seawater increase the number of days it takes for oyster…
Q: Draw a graph with the following given adjacency matrix. 0111 1001 1001 1110
A:
Q: Use the following cell phone airport data speeds (Mbps) from a particular network. Find Q1. 0.1…
A: The is arranged in ascending order with n = 50 min = 0.1 & max = 28.7 To find Q1, first we find…
Q: A chicken farmer surveyed his flock with the following results (Assume that all chickens are thin or…
A: According to Bartleby's guidelines, the solution of the first three subpart questions will be…
Q: A recent study from Pew Research Center indicates 77% of adults in the United States use a…
A: a) Given that SP has 77% , BB has 65% , BB and SP= 52% Using this we draw a Venn diagram.
Q: Use the following cell phone airport data speeds (Mbps) from a particular network. Find Q3. 0.2…
A: Given that The data are 0.2 0.2 0.3 0.3 0.3 0.3 0.4 0.4 0.5 0.6 0.6…
Q: company that offers courses to prepare future MBA students for the GMAT exam finds that 40% of its…
A: Here Given P(U)= Probability of undergraduate student=0.4 P(G)=Probability of graduate student=0.6…
Q: 34) How many spanning trees does the following network have? A EO B D A) 5 В) 4 С) 3 D) 8
A: Trees having n-1 edges and tree is always connected. From these two properties we got answer.
Q: Use the following cell phone airport data speeds (Mbps) from a particular network. Find P50- 0.2 0.3…
A: It is given that the 50 cell phone airport data speeds and it is in ascending order.
Q: Match each definition with the correct term. If the outcome of one event affects the outcome of…
A: Each statement are matched with appropriate option.
Q: Use the following cell phone airport data speeds (Mbps) from a particular network. Find Peo. 0.2 0.2…
A: Arrange data in accending order…
Q: Determine two different Hamilton paths in the following graph. A В C D G Select all that apply. O A.…
A: solution
Q: 2. Consider the social network in Figure 6.14. Using degree as a measure of centrality, which…
A: A node's degree is a count of how many social connections (i.e., edges) it has.
Q: #1 On a Thursday, Jeanie decided that she would like to have a dinner party for a few of her…
A:
Q: Consider the following network 1 2 5 4 Which is the diameter of this network? ONone of the 1 above…
A: Every network has a diameter. It is related to the nodes lying in the maximum distance. The shortest…
Q: Former pro football star O.J. Simpson was accused of murdering his wife. In the trial, a defense…
A: The tree diagram is given as follows:
Q: Create the network diagram for the given activities below Predecessor Duration (days! Activity A 6 B…
A:
Q: 4. The following bar graph represents the undergraduate majors for 150 law students. Use the graph…
A: It is a very important part of analysing through representation by diagrams . It is widely used in…
Q: Use the following cell phone airport data speeds (Mbps) from a particular network. Find P20 0.1 0.2…
A: Obtain the Percentile P20. The Percentile P20 is obtained below as follows: From the information,…
Q: Use the following cell phone airport data speeds (Mbps) from a particular network. Find Q,. 0.2 0.3…
A: From the provided information, Number of observations (n) = 50 The provided data is in ascending…
Q: The following items represent the number of birds observed at a given feeder over the past several…
A: Given data, 47, 47, 66, 81, 42, 33, 42, 13, 33, 42, 72, 81, 5 The objective is to find the mode…
Q: Use the following cell phone airport data speeds (Mbps) from a particular network. Find Q3. 0.2…
A: To find the third quartile Numbers have to be placed in ascending order. 0.2 , 0.2 , 0.3 , 0.3 ,…
Q: Use the following cell phone airport data speeds (Mbps) from a particular network. Find Qg. 0.1 0.2…
A:
Q: es of Government C Clever | Log in…
A: Let us know the eligibility conditions, Legislative Branch: One must be 25 years old and a U.S…
Q: (16 points) Below is a network diagram consisting of 7 cities and their associated distances in…
A: Given that, V = Valparaiso P = Portage G = Gary Ha = Hammond Hi= Highland M= Merrillville L =…
Q: Use the following cell phone airport data speeds (Mbps) from a particular network. Find Q1. 0.2…
A: The first quartile is the measure that represents the first 25% of the data. To calculate Q1 -First…
Q: Use the following cell phone airport data speeds (Mbps) from a particular network. Find Q1. 0.1…
A: we have to find Q1 for given data...
Q: Determine the type of association apparent in the following scatterplot. 10) A) Negative…
A: We given following scatter plot
Q: Use the following cell phone airport data speeds (Mbps) from a particular network. Find Q3- 0.1 0.2…
A:
Q: Use the following cell phone airport data speeds (Mbps) from a particular network. Find P80. 0.4…
A: We have t find the data speed of P80.
Q: A network provider investigates the load of its network. The number of concurrent users is recorded…
A:
Q: As the Project Manager of ABC Construction Company, you are involved in drawing a network for laying…
A: Expected time of an activity in PERT is defined as a weighted average of the most optimistic time…
Q: (Type an integer or a decimal. Do not round.)
A: 0.1 0.2 0.2 0.3 0.3 0.3 0.3 0.5 0.5 0.5 0.6 0.7 0.8 0.8 0.9 0.9 1.2…
Q: b) in a competition, a school awarded medals in three different categories. 25 medals in dance(D),…
A: Let A be the number of students who got medal in acting, similarly M for music and D is for dance.…
Q: Draw and analyse the arrow network for the following activities by using PERT method assuming three…
A:
Q: Find the number of odd and even vertices in each network. Imagine travelingeach network to see if it…
A: Solution: (1) Consider the given graph of the square with both diagonals like Here the vertices…
Q: Use the following cell phone airport data speeds (Mbps) from a particular network. Find Q, 0.2 0.2…
A: The formula for calculating the first quartile is, Here, n = number of values in a data set The…
Q: The following data covering 1000 students (eng’g) were taken from the records of the registrar at…
A: The given information is in Venn-diagram is as follows:
Q: Homework3: Draw the network diagram by using AOA technique for the following activities, define the…
A: We have given, a table consist (activity, precedent activity and time) We have to draw network…
Q: Find the network response ?
A:
Q: Given the set of activities indicated in the table below, construct a network diagram with the…
A: Network diagram is:


Trending now
This is a popular solution!

Step by step
Solved in 2 steps with 1 images

- The owner of a pet store is trying to decide whether to discontinue selling specialty clothes for pets. She suspects that only 10% of the customers buy specialty clothes for their pets and thinks that she might be able to replace the clothes with more interesting and profitable items on the shelves. Before making a final decision she decides to keep track of the total number of customers for a day, and whether they purchase specialty clothes for their pet. a) Assuming the pet store owner is correct in thinking that only 10% of her customers purchase specialty clothes for their pets, how many customers should she expect before someone buys a garment for their pet? b) What is the probability that she does not sell a garment until the 5th customer? c) What is the probability that exactly 4 of the first 10 customers buy specialty clothes for their pet? d) What is the probability that at least 3 of the first 35 customers buy specialty clothes for their pet?…Construct a Cayley table for U(12)Use the following cell phone airport data speeds (Mbps) from a particular network. Find P80. 0.1 0.1 0.2 0.3 0.3 0.3 0.3 0.3 0.3 0.4 0.6 0.6 0.8 0.8 0.9 1.1 1.4 1.6 1.7 1.8 1.9 2.1 2.4 2.7 2.9 2.9 3.2 3.5 3.5 3.9 4.9 5.2 5.6 5.9 6.8 8.2 8.3 10.4 11.4 12.3 12.9 13.2 13.4 13.6 13.9 14.3 14.6 14.9 15.9 27.9
- Use the following information to create a two way table showing the number of students enrolled in certain subjects by gender.In a survey of 200 MDM4U students, the following information was found:68 enjoy crosswords,97 enjoy baking,71 enjoy acting,20 enjoy acting and crosswords,29 enjoy acting and baking,23 enjoy baking and crosswords,28 do not enjoy any of those three activities.Explaining any calculations, a. How many people enjoy all three activities? b. How many people enjoy only acting, and only baking? c. Create a Venn diagram that depicts the number of students who enjoy the activities. You may draw your diagram and scan or photograph it, you may create it electronically, or if you are unable to complete this activity visually, you may describe the components of the diagram in detail.Students who are home-schooled often attend their local schools to participate in various types of activities such as sports or musical ensembles. According to the government, 82% of home-schoolers receive their education entirely at home, while 12% attend school up to 9 hours per week and 6% spend from 9 to 25 hours per week at school. A survey of 85 students who are home-schooled revealed the following information about where they receive their education. Entirely at home Up to 9 hours 9 to 25 hours 50 25 10 At α=0.05, is there suffificient evidence to conclude that the proportions differ from those stated by the government?
- In a survey of 200 MDM4U students, the following information was found:68 enjoy crosswords,97 enjoy baking,71 enjoy acting,20 enjoy acting and crosswords,29 enjoy acting and baking,23 enjoy baking and crosswords,28 do not enjoy any of those three activities.Explaining any calculations, a. How many people enjoy all three activities? b. How many people enjoy only acting? c. How many people enjoy only baking? d. Create a Venn diagram that depicts the number of students who enjoy the activities. You may draw your diagram and scan or photograph it, you may create it electronically, or if you are unable to complete this activity visually, you may describe the components of the diagram in detail.In March 2017, 9,195 men took trips with median duration of 300 seconds, and 2,439 women took trips with median duration of 319 seconds, on New York City's ride sharing program, Citibike. Overall, what was the median duration of all Citibike ride trips that month? A. 304 seconds B. 315 seconds C. 309.5 seconds D. None of these. E. Cannot be determinedwhat would be a careful interpretation of the 12% in the two-way table?
- A manager at a local discount gym believes that less than 20% of gym members use the gym, at least 5 days a week. She randomly selects 100 gym members and tracks (using the electronic login system at the door) how many days they used the gym over the 2-week period. The following are the results: 2 3 10 4 2 3 8 4 8 10 5 0 6 3 9 13 6 3 12 5 3 3 5 1 5 9 8 5 8 2 6 4 4 2 12 1 3 3 2 12 7 3 14 2 8 5 2 6 1 5 6 9 6 8 10 1 11 3 2 1 5 4 1 2 3 13 7 4 8 3 7 4 3 2 10 3 1 7 11 8 4 7 6 7 8 11 7 6 3 2 5 0 4 6 5 12 2 10 1 2 Test the manager's claim at the 2.5% level of significance. Standard Normal Distribution Table a. Calculate the test statistic. z=�= Round to two decimal places if necessary Enter 0 if normal approximation to the binomial cannot be used b. Determine the critical value(s) for the hypothesis test. Round to two decimal places if necessary Enter 0 if normal approximation to the binomial cannot be used c. Conclude whether to reject the null hypothesis or…The following are the data regarding the enrollment of 100 students in the subjects MMW, STS, and NSTP. Draw a Venn Diagram representing the data. 60 enrolled in MMW 40 enrolled in STS 50 enrolled in NSTP 28 enrolled in STS and MMW 24 enrolled in STS and NSTP 22 enrolled in MMW and NSTP 10 enrolled in three subjects
