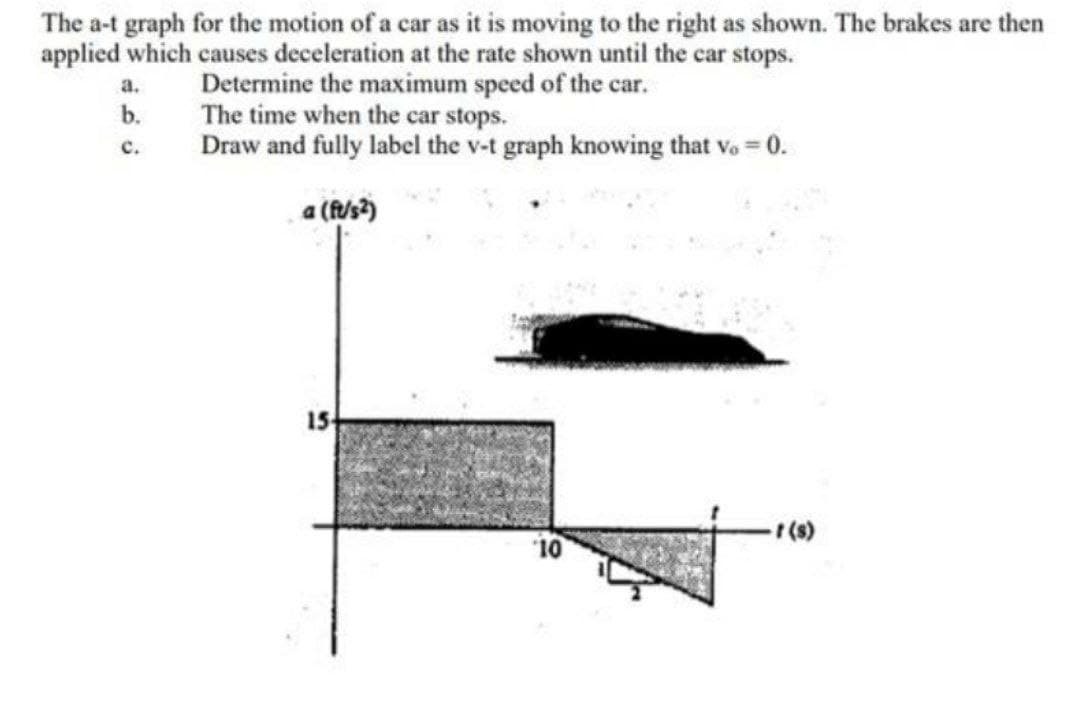
The a-t graph for the motion of a car as it is moving to the right as shown. The brakes are then applied which causes deceleration at the rate shown until the car stops. Determine the maximum speed of the car. The time when the car stops. Draw and fully label the v-t graph knowing that vo = 0. a. b. с. a (f/s) 15 "10


Q: A stone is dropped from the roof of a high building. A second stone is dropped 1.40 s later. Part A…
A:
Q: 4. Recall that Newton's law is F = ma, where F is the net force, m is the mass and a is the…
A:
Q: a stone is dropped from the deck of a bridge. the sound of the splash reached the deck 3 seconds…
A: Let h is height of deck from water.Splash was heard after 3 sec.speed of sound=v'=342 m/sg=9.8 m/s2
Q: The a-t graph for the motion of a car as it is moving to the right as shown. The brakes are then…
A:
Q: A lead ball is dropped into a lake from a diving board 5.60 m above the water. After entering the…
A:
Q: The dragster starts from rest and has an acceleration described by the graph below. Determine the…
A: From the given graph, we need to find the time to stop t', maximum speed vM, and construct the v-t…
Q: 1. 1. Draw a graph of velocity as a function of time 2. Determine the following from your graph: (a)…
A: Solution: Given that the ball is dropped from the height, the velocity vs time values are given.
Q: (b) Rock B hits the ground at time tB . Derive an equation for the time tA it takes rock A to hit…
A:
Q: An object, m, is released from rest and slides down on a smooth inclined plane with a distance 5, as…
A: The force f=ma where m is mass and a is acceleration The acceleration of a object falling down an…
Q: (c) Sketch a Position-Time graph of this data. Plot the Position data in meters, and plot the Time…
A:
Q: Standing on a bridge, you throw a stone straight upward. The stone hits a stream, 28.3 m below the…
A:
Q: The Tesla Model S P85 electric car accelerates from 0 to 30 mph in 1.4 s, 0 to 60 mph in 3.5 s and 0…
A: Given,
Q: The a-t graph for the motion of a car as it is moving to the right as shown. The brakes are then…
A:
Q: Alma caught an earlier bus to school. She noticed that she travelled the 12 km route 15 min faster…
A: In this question we are given that Alma caught an earlier bus to school. She noticed that she…
Q: 22. The graph above shows the position of a car, in meters, measured from a stoplight after the…
A:
Q: I don't get it
A: Given,
Q: A KTM commuter train travels between two stations, A and B. The train starts from rest from station…
A: Initial velocity at A, u1=0 and velocity after distance d1=0.5 km=500 m is v1=30 m/s. After time T…
Q: A sprinter running a 100-meter race starts at rest, accelerates at constant acceleration with…
A: Given Data : The distance travelled by the sprinter is given as L = 100m The time for which it…
Q: 1. A stone is dropped into a well and 4.5 seconds later the sound of the splash is heard. Then a…
A: Assume the velocity of the sound is denoted by v = 1120 ft/s. Assume the acceleration due to gravity…
Q: 5) As a better estimate of the velocity of the cart when t= 3.0 seconds, find the average velocity…
A:
Q: The a-t graph for the motion of a car as it is moving to the right as shown. The brakes are then…
A:
Q: Lvariable. Time always appears on the. Time is always considered the. axis of a graph. What is the…
A: Since we only answer up to 3 sub-parts, we’ll answer the first 3. Please resubmit the question and…
Q: Standing on a bridge, you throw a stone straight upward. The stone hits a stream, 32.5 m below the…
A: distance = 32.5; time= 3.10 sec; speed = ?
Q: 4 Britnee is texting and driving in her passenger car when she looks up and realizes that a big rig…
A: Given Data: Distance d = 16 m Initial velocity v =15 m/s stopping distance s = 16-1.5=14.5 m
Q: hor vert AX 9002 AX:186m AL lo /s
A: Solution: Given that the vertical and horizontal componetns of the kinematic motion
Q: 8. Assignment Booklet 4A 13. What does the run between two points on a distance/time graph…
A: 13) A distance time graph is given for an object
Q: Average Speed = Overall Distance/Total Time units = m/s /p 16. A physics student rides a moped for 1…
A:
Q: .A stone is dropped into a well and 4.5 seconds later the sound of the splash is heard. Then a…
A: In this case, the first stone is dropped with zero initial velocity whereas the second is thrown…
Q: 1. The graphs below were based on results from a motion detector. Describe how each walk happened.…
A:
Q: A car traveling 97 km/h is 240 m behind a truck traveling 81 km/h. Part A How long will it take the…
A:
Q: The a-t graph for the motion of a car as it is moving to the right as shown. The brakes are then…
A:
Q: 1- How do you find the units of acceleration? h = gt?/2 Solve this equation for g
A: Since you have asked multiple questions, we will solve the first one for you. If you want any…
Q: A high-performance sports car can go from 0 to 100 mph in 7.0 s. (Assume the car travels in the…
A: Given: Initial velocity (u) = 0 mph. = 0 m/s. Final velocity (v) = 100 mph. = 44.704 m/s. Time taken…
Q: You're driving at 50 km/h, when the traffic light 40 m away turns yellow. A. Find the constant…
A:
Q: 1. The quantity represented by the area enclosed under velocity-time graph is a) Distance b) Speed…
A:
Q: If an average-size man jumps from an airplane with an open parachute, his downward velocity t…
A:
Q: I Review The motorcycle is traveling at 40 m/s when it is at A. The speed is then decreased at v =…
A: Given : v = 40 m/s v. = -(0.05s) m/s2 ρ = 160 m
Q: In physics, what is motion? Additionally, describe different motions.
A: In physics, motion is defined as the change in the position of an object with respect to a fixed…
Q: PHET Step 12: Sketch this track and label where the 5 spots could be. a. He is at his maximum speed…
A:
Q: P t S/ © 2012 Pearson Education, Inc. This is the x-t graph of the motion of a particle. At which…
A: The position versus time graph is given for a particle in motion. The position is plotted along y…
Q: You jog at 9.5 km/h for 5.0 km , then you jump into a car and drive an additional 19 km Part A With…
A: The average speed of the body is the total distance traveled by the body divided by the elapsed time…
Q: Task VI: As a technical engineer in the army, you are part of a team in charge of testing and…
A:
Q: I need
A: Given Data: Constant velocity V = 150 Km/hr or V = 150*1000/3600 m/s V = 41.667 m/s…
Q: Assignment Booklet 4A 3. What does the run between two points on a distance/time graph represent? A.…
A:
Q: 1) 1) Assuming systematic and random errors in the speedometer of a car, to prevent the speed from…
A: It is a good idea to do systematic and random errors in the speedometer of a car to prevent the…
Q: Which of the following velocity-time graphs best describes the motion of an object (with the…
A: The velocity time graph is given for object in motion. The velocity is plotted along the y axis and…
Q: Determine the distance traveled (m) at t=180s in the graph below.
A: Given, Distance covered in 180 sec is D=???
Q: Oil Calculate the acceleration for each part of the following journey. Velocity (ms) 0 (a) Figure…
A: (i) Acceleration for each part is the slope of the graph for that part. Thus we have: (a) a =…
Q: Graphing Motion Purpose a) Construct distance-time graphs from given tabulated data. b) Describe…
A: 1) Graph of above-tabulated data i.e., distance v/s time is shown as below-

Step by step
Solved in 3 steps with 3 images

- A brick becomes dislodged from the top of a state building (at a height of 1220 feet) and falls to the sidewalk below. (a) Write the position, velocity, and acceleration functions of the brick. (b) How long does it take the brick to hit the sidewalk? (Use two decimal places.) (c) How fast is the brick traveling when it hits the sidewalk. (Use one decimal place.)A high-performance sports car can go from 0 to 100 mph in 7.0 s. (Assume the car travels in the positive direction. Indicate the direction with the sign of your answer.) (a) What is the car's average acceleration (in SI units; meter-kilogram-second)?(b) The same car can come to a complete stop from 31 m/s in 3.9 s. What is its average acceleration?A KTM commuter train travels between two stations, A and B. The train starts from rest from station A and accelerates at a constant rate for 0.5 km until it reaches a speed of 30 m/s. It then travels at this constant speed for T s before decelerating at a constant rate of 1.5 m/s2 and coming to rest at station B. Figure 1 shows the velocity-time graph of the train’s journey between the two stations. Determine the value of T if the distance between the two stations 6 km. Calculate also the total time taken for the whole journey.
- 1. For the graph of position vs. time. a. Describe the shape of the graph. Explain how the motion of the ball corresponds to the shape of the graph. What is the positive direction? b. What is the best regression equation to fit the data? (linear, power, exponential, etc) c. What does the slope represent on this graph? For the graph of velocity vs. time a. Describe the shape of the graph. Explain how the motion of the ball corresponds to the shape of the graph. What is the positive direction? b. What is the best regression equation to fit the data? (linear, power, exponential, etc) c. What does the slope represent on this graph?A car travels 22 km south, 12 km west, and 14 km north in halfan hour. (See the figure below) a) What is the average speed of the car?b) What is the final displacement of the car?c) What is the average velocity of the car?Sn object moves in a straight line in one dimension as shown below. What can be concluded about the object's velocity and acceleration? The picture is attached
- 1. 1. Draw a graph of velocity as a function of time2. Determine the following from your graph:(a) The change in velocity per unit change in time (i.e. acceleration of the ball). Illustrate onyour graph and show the calculation below. (b) The velocity at t = 0.84 s (interpolation). Illustrate on your graph and write the value below.(c) The velocity at t = 1.74 s (extrapolation). Illustrate on your graph and write the value below.(d) Set up an empirical equation for the velocity of the ball at different times. This equationshould use the numerical values of the constants and indicate their units.1. A ball was dropped from a building and reached the ground in 4.00s. Show the equations that you use and all calculations. a) How much was the height of the building? b) How fast was it going when it hit the ground? c) How much is the acceleration of the ball? Give both magnitude and direction (up or down). ExplainA car is crashed into a tree at the speed of 144 km/h. It took the car 4 seconds to stop. Assume that the car withstood the collision without substantial damage, and the driver received no more than superficial bruises to the surface of her body. (a) Draw a diagram that represent the collision and label all vector quantities. Make sure you pick axes and indicate directionality with signs and unit vectors. (b) Assuming that the acceleration was uniform during the collision, calculate the acceleration and indicate its direction on your diagram. (c) If (at best) a person can withstand 9g acceleration (9 × 9.8m/s ^2 = 88.2 m/s^2 ) only for a few seconds, is the driver of the car survived the crash?
- Ana throws a toy upward and it takes the toy 4.8 seconds to reach the max point before it falls to Ana's hands.(a) What is the initial velocity of the toy?(b) What is the distance travelled by the toy from the point of release to the max point? Include a diagram and the laws/theorems of physics applied in your calculationsProvide an explanation on outlining the underlying physics principle and using correct terminologies. In answering these problems, apply appropriate formulae, principles, and equations. A. Can an object have a constant speed but varying velocity ?Draw a velocity versus time graph for an object whose constant velocity is 15 m/s and whose position starts at x= 0 when t = 0 Graph the motion for the first 5.0 seconds. A.) For the motion graphed in the position versus time graph shown above, what is the average velocity in the time interval 1 to 3 seconds? B.) For the motion graphed in the position versus time graph shown above, what is the average velocity in the time interval 3 to 4 seconds? C.) For the motion graphed in the position versus time graph shown above, what is the average velocity in the time interval 5 to 6 seconds?