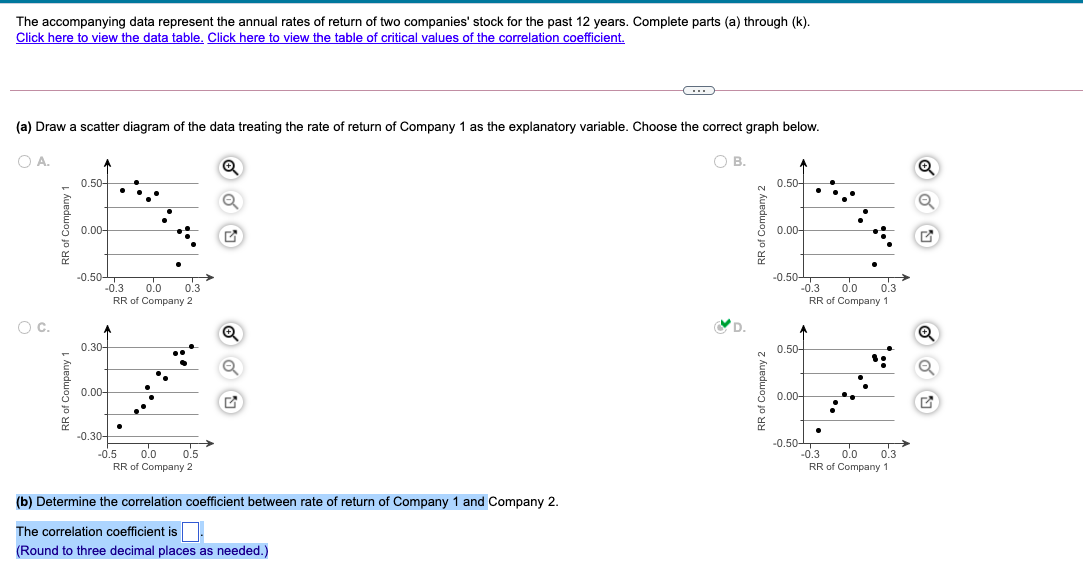
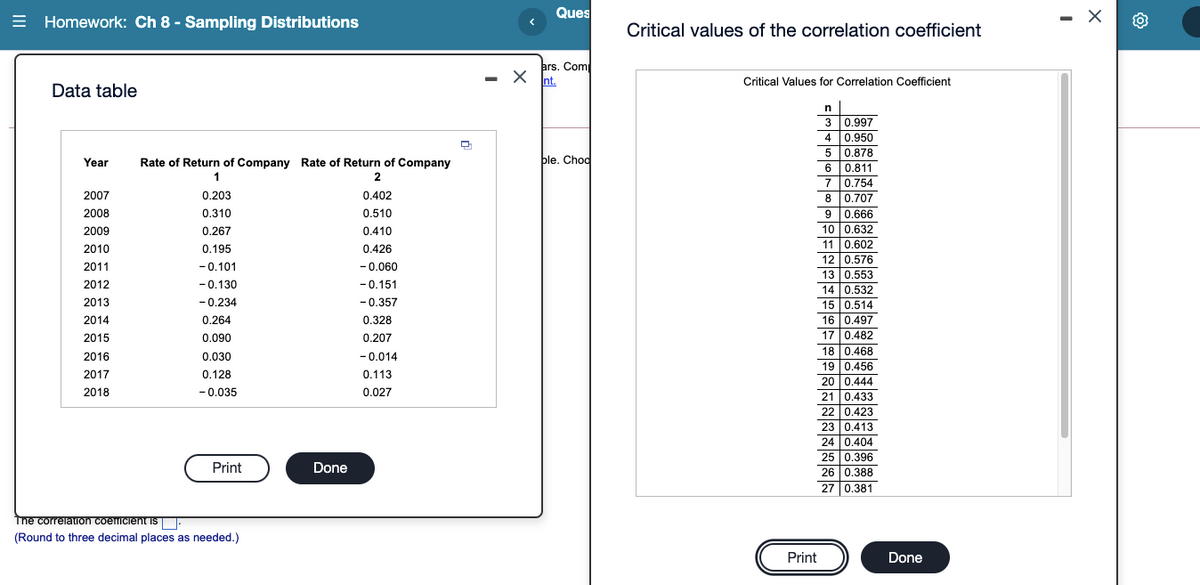
The accompanying data represent the annual rates of return of two companies' stock for the past 12 years. Complete parts (a) through (k). Click here to view the data table. Click here to view the table of critical values of the correlation coefficient. (a) Draw a scatter diagram of the data treating the rate of return of Company 1 as the explanatory variable. Choose the correct graph below. O A. OB. 0.50- 0.50- 0.00- 0.00- -0.50- -0.3 RR of Company 2 -0.50- -0.3 RR of Company 1 0.0 0.3 0.0 0.3 VD. 0.30- 0.50- 0.00- 0.00- -0.30- -0.50- -0.5 0.0 0.5 -0.3 0.0 0.3 RR of Company 2 RR of Company 1 (b) Determine the correlation coefficient between rate of return of Company 1 and Company 2. The correlation coefficient is. (Round to three decimal places as needed.) RR of Company 1 RR of Company 1 RR of Company 2 RR of Company 2
The accompanying data represent the annual rates of return of two companies' stock for the past 12 years. Complete parts (a) through (k). Click here to view the data table. Click here to view the table of critical values of the correlation coefficient. (a) Draw a scatter diagram of the data treating the rate of return of Company 1 as the explanatory variable. Choose the correct graph below. O A. OB. 0.50- 0.50- 0.00- 0.00- -0.50- -0.3 RR of Company 2 -0.50- -0.3 RR of Company 1 0.0 0.3 0.0 0.3 VD. 0.30- 0.50- 0.00- 0.00- -0.30- -0.50- -0.5 0.0 0.5 -0.3 0.0 0.3 RR of Company 2 RR of Company 1 (b) Determine the correlation coefficient between rate of return of Company 1 and Company 2. The correlation coefficient is. (Round to three decimal places as needed.) RR of Company 1 RR of Company 1 RR of Company 2 RR of Company 2

Glencoe Algebra 1, Student Edition, 9780079039897, 0079039898, 2018
18th Edition
ISBN:9780079039897
Author:Carter
Publisher:Carter
Chapter10: Statistics
Section: Chapter Questions
Problem 25SGR

Related questions
Question
Transcribed Image Text:The accompanying data represent the annual rates of return of two companies' stock for the past 12 years. Complete parts (a) through (k).
Click here to view the data table. Click here to view the table of critical values of the correlation coefficient.
(a) Draw a scatter diagram of the data treating the rate of return of Company 1 as the explanatory variable. Choose the correct graph below.
O A.
OB.
0.50-
0.50-
0.00-
0.00-
-0.50-
-0.3
RR of Company 2
-0.50-
-0.3
RR of Company 1
0.0
0.3
0.0
0.3
VD.
0.30-
0.50-
0.00-
0.00-
-0.30-
-0.50-
-0.5
0.0
0.5
-0.3
0.0
0.3
RR of Company 2
RR of Company 1
(b) Determine the correlation coefficient between rate of return of Company 1 and Company 2.
The correlation coefficient is.
(Round to three decimal places as needed.)
RR of Company 1
RR of Company 1
RR of Company 2
RR of Company 2
Transcribed Image Text:Ques
= Homework: Ch 8 - Sampling Distributions
Critical values of the correlation coefficient
ars. Com
- X Int.
Critical Values for Correlation Coefficient
Data table
3 0,997
4 0.950
5 0.878
6 0.811
7 0.754
Year
Rate of Return of Company Rate of Return of Company
ble. Chod
6
2
2007
0.203
0.402
8
0.707
9 0.666
10 0.632
2008
0.310
0.510
2009
0.267
0.410
11 0.602
12 0.576
13 0.553
14 0.532
15 0.514
16 0.497
2010
0.195
0.426
2011
-0.101
-0.060
2012
- 0.130
-0.151
2013
-0.234
-0.357
2014
0.264
0.328
17 0.482
18 0.468
19 0.456
20 0.444
21 0.433
2015
0.090
0.207
2016
0.030
-0.014
2017
0.128
0.113
2018
- 0.035
0.027
22 0.423
23 0.413
24 0.404
25 0.396
Print
Done
26 0.388
27 0.381
Tne correlauon coeicient is-
(Round to three decimal places as needed.)
Print
Done
Expert Solution
This question has been solved!
Explore an expertly crafted, step-by-step solution for a thorough understanding of key concepts.

This is a popular solution!

Trending now
This is a popular solution!

Step by step
Solved in 2 steps with 2 images

Recommended textbooks for you
Glencoe Algebra 1, Student Edition, 9780079039897…
Algebra
ISBN:
9780079039897
Author:
Carter
Publisher:
McGraw Hill
Glencoe Algebra 1, Student Edition, 9780079039897…
Algebra
ISBN:
9780079039897
Author:
Carter
Publisher:
McGraw Hill