The accompanying data represent the miles per gallon of a random sample of cars with a three-cylinder, 1.0 liter engine. (a) Compute the z-score corresponding to the individual who obtained 35.8 miles per gallon. Interpret this result. (b) Determine the quartiles. (c) Compute and interpret the interquartile range, IQR. (d) Determine the lower and upper fences. Are there any outliers? E Click the icon to view the data. MPG Data The upper fence is (Type integers or decimals. Do not round.) Are there any outliers? Select the correct choice below and, if necessary, fill, in the answer box to complete your choice. 40.2 40.6 41.3 41.6 35.9 37.8 38.1 38.2 38.6 38.7 38.9 42.5 32.2 34.3 36.4 43.0 37.4 37.6 34.7 39.2 43.3 O A. The outlier(s) is/are 35.8 39.5 48.9 (Type an integer or a decimal. Do not round. Use a comma to separate answers as needed.) O B. There are no outliers. Print Done
The accompanying data represent the miles per gallon of a random sample of cars with a three-cylinder, 1.0 liter engine. (a) Compute the z-score corresponding to the individual who obtained 35.8 miles per gallon. Interpret this result. (b) Determine the quartiles. (c) Compute and interpret the interquartile range, IQR. (d) Determine the lower and upper fences. Are there any outliers? E Click the icon to view the data. MPG Data The upper fence is (Type integers or decimals. Do not round.) Are there any outliers? Select the correct choice below and, if necessary, fill, in the answer box to complete your choice. 40.2 40.6 41.3 41.6 35.9 37.8 38.1 38.2 38.6 38.7 38.9 42.5 32.2 34.3 36.4 43.0 37.4 37.6 34.7 39.2 43.3 O A. The outlier(s) is/are 35.8 39.5 48.9 (Type an integer or a decimal. Do not round. Use a comma to separate answers as needed.) O B. There are no outliers. Print Done

Glencoe Algebra 1, Student Edition, 9780079039897, 0079039898, 2018
18th Edition
ISBN:9780079039897
Author:Carter
Publisher:Carter
Chapter10: Statistics
Section: Chapter Questions
Problem 22SGR

Related questions
Question
Practice Pack
Time sensitive need help ASAP
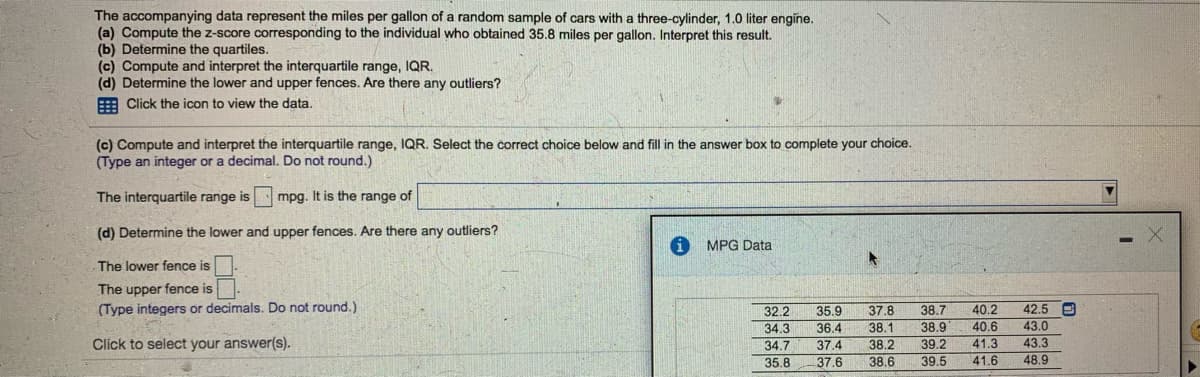
Transcribed Image Text:The accompanying data represent the miles per gallon of a random sample of cars with a three-cylinder, 1.0 liter engine.
(a) Compute the z-score corresponding to the individual who obtained 35.8 miles per gallon. Interpret this result.
(b) Determine the quartiles.
(c) Compute and interpret the interquartile range, IQR.
(d) Determine the lower and upper fences. Are there any outliers?
Click the icon to view the data.
(c) Compute and interpret the interquartile range, IQR. Select the correct choice below and fill in the answer box to complete your choice.
(Type an integer or a decimal. Do not round.)
The interquartile range is
mpg. It is the range of
(d) Determine the lower and upper fences. Are there any outliers?
MPG Data
The lower fence is
The upper fence is
(Type integers or decimals. Do not round.)
37.8
38.1
38.2
32.2
35.9
38.7
40.2
42.5 D
34.3
34.7
38.9
39.2
39.5
36.4
40.6
43.0
Click to select your answer(s).
37.4
41.3
43.3
35.8
37.6
38.6
41.6
48.9
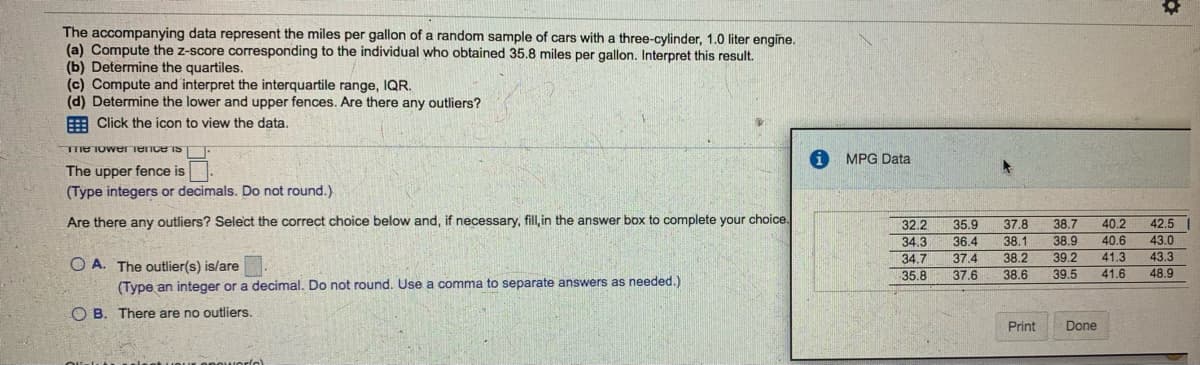
Transcribed Image Text:The accompanying data represent the miles per gallon of a random sample of cars with a three-cylinder, 1.0 liter engine.
(a) Compute the z-score corresponding to the individual who obtained 35.8 miles per gallon. Interpret this result.
(b) Determine the quartiles.
(c) Compute and interpret the interquartile range, IQR.
(d) Determine the lower and upper fences. Are there any outliers?
E Click the icon to view the data.
TTE TOwernence iS
MPG Data
The upper fence is
(Type integers or decimals. Do not round.)
Are there any outliers? Select the correct choice below and, if necessary, fill, in the answer box to complete your choice.
32.2
35.9
37.8
38.7
40.2
42.5
34.3
36.4
38.1
38.9
40.6
43.0
34.7
37.4
38.2
39.2
41.3
43.3
O A. The outlier(s) is/are
35.8
37.6
38.6
39.5
41.6
48.9
(Type an integer or a decimal. Do not round. Use a comma to separate answers as needed.)
O B. There are no outliers.
Print
Done
Expert Solution
This question has been solved!
Explore an expertly crafted, step-by-step solution for a thorough understanding of key concepts.

This is a popular solution!

Includes step-by-step video

Trending now
This is a popular solution!

Learn your way
Includes step-by-step video

Step by step
Solved in 2 steps

Knowledge Booster


Learn more about
Need a deep-dive on the concept behind this application? Look no further. Learn more about this topic, statistics and related others by exploring similar questions and additional content below.Recommended textbooks for you
Glencoe Algebra 1, Student Edition, 9780079039897…
Algebra
ISBN:
9780079039897
Author:
Carter
Publisher:
McGraw Hill
Glencoe Algebra 1, Student Edition, 9780079039897…
Algebra
ISBN:
9780079039897
Author:
Carter
Publisher:
McGraw Hill