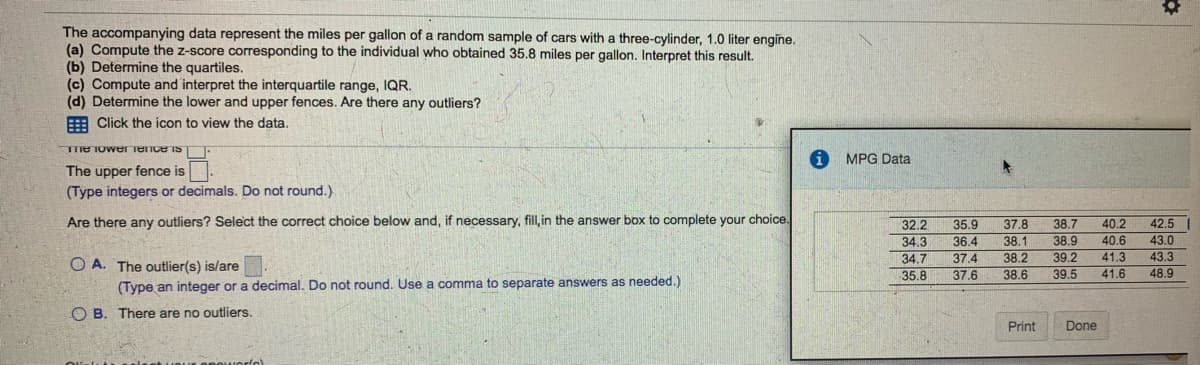
The accompanying data represent the miles per gallon of a random sample of cars with a three-cylinder, 1.0 liter engine. (a) Compute the z-score corresponding to the individual who obtained 35.8 miles per gallon. Interpret this result. (b) Determine the quartiles. (c) Compute and interpret the interquartile range, IQR. (d) Determine the lower and upper fences. Are there any outliers? E Click the icon to view the data. TIE TUwenence IS MPG Data The upper fence is (Type integers or decimals. Do not round.) Are there any outliers? Select the correct choice below and, if necessary, fill, in the answer box to complete your choice. 40.2 40.6 32.2 35.9 37.8 38.7 42.5 36.4 38.1 38.9 43.0 34.3 34.7 35.8 37.4 38.2 39.2 41.3 43.3 O A. The outlier(s) is/are 37.6 38.6 39.5 41.6 48.9 (Type an integer or a decimal. Do not round. Use a comma to separate answers as needed.) O B. There are no outliers. Print Done


Inverse Normal Distribution
The method used for finding the corresponding z-critical value in a normal distribution using the known probability is said to be an inverse normal distribution. The inverse normal distribution is a continuous probability distribution with a family of two parameters.
Mean, Median, Mode
It is a descriptive summary of a data set. It can be defined by using some of the measures. The central tendencies do not provide information regarding individual data from the dataset. However, they give a summary of the data set. The central tendency or measure of central tendency is a central or typical value for a probability distribution.
Z-Scores
A z-score is a unit of measurement used in statistics to describe the position of a raw score in terms of its distance from the mean, measured with reference to standard deviation from the mean. Z-scores are useful in statistics because they allow comparison between two scores that belong to different normal distributions.


Trending now
This is a popular solution!

Step by step
Solved in 2 steps with 5 images


