The accompanying data show the number of bacteria present after a certain number of hours. Find the equation of the regression line for the data. Then construct a scatter plot of (x,y).
The accompanying data show the number of bacteria present after a certain number of hours. Find the equation of the regression line for the data. Then construct a scatter plot of (x,y).

Algebra & Trigonometry with Analytic Geometry
13th Edition
ISBN:9781133382119
Author:Swokowski
Publisher:Swokowski
Chapter2: Equations And Inequalities
Section2.1: Equations
Problem 57E

Related questions
Question
The accompanying data show the number of bacteria present after a certain number of hours. Find the equation of the regression line for the data. Then construct a scatter plot of (x,y).
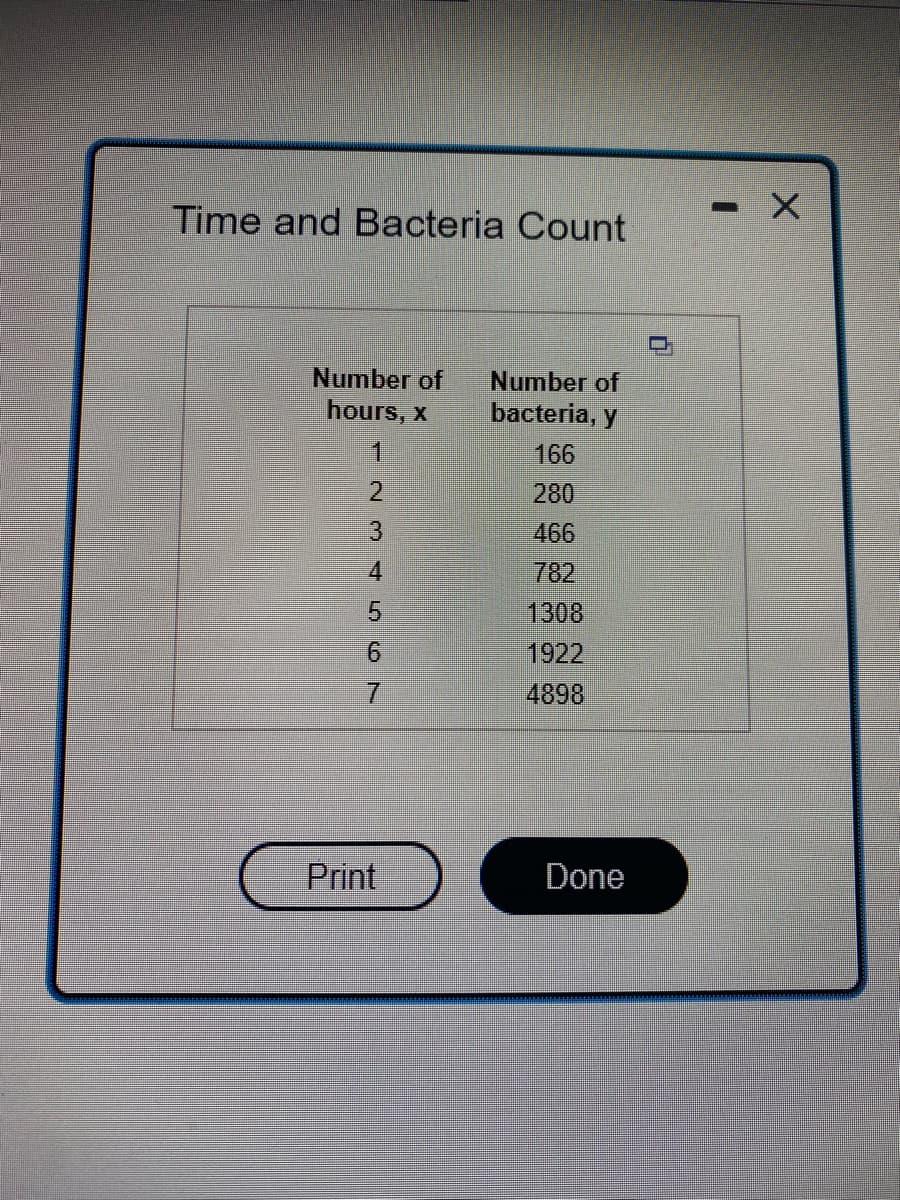
Transcribed Image Text:Time and Bacteria Count
Number of
hours, x
1
NGAWN →
2
3
4
5
6
7
Print
Number of
bacteria, y
166
280
466
782
1308
1922
4898
Done
0
-
X
Transcribed Image Text:The equation of the regression line is ŷ = x+0
y
(Round to two decimal places as needed.)
Expert Solution
This question has been solved!
Explore an expertly crafted, step-by-step solution for a thorough understanding of key concepts.

This is a popular solution!

Trending now
This is a popular solution!

Step by step
Solved in 3 steps with 1 images

Recommended textbooks for you
Algebra & Trigonometry with Analytic Geometry
Algebra
ISBN:
9781133382119
Author:
Swokowski
Publisher:
Cengage
Algebra & Trigonometry with Analytic Geometry
Algebra
ISBN:
9781133382119
Author:
Swokowski
Publisher:
Cengage