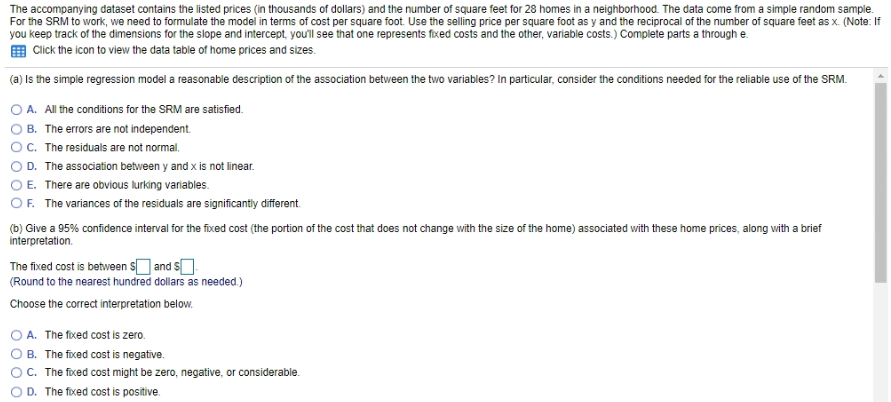
The accompanying dataset contains the listed prices (in thousands of dollars) and the number of square feet for 28 homes in a neighborhood. The data come from a simple random sample. For the SRM to work, we need to formulate the model in terms of cost per square foot. Use the selling price per square foot as y and the reciprocal of the number of square feet as x. (Note: If you keep track of the dimensions for the slope and intercept, you'll see that one represents fixed costs and the other, variable costs.) Complete parts a through e. Click the icon to view the data table of home prices and sizes. (a) Is the simple regression model a reasonable description of the association between the two variables? In particular, consider the conditions needed for the reliable use of the SRM. ○ A. All the conditions for the SRM are satisfied. OB. The errors are not independent. OC. The residuals are not normal. OD. The association between y and x is not linear. O E. There are obvious lurking variables. OF. The variances of the residuals are significantly different. (b) Give a 95% confidence interval for the fixed cost (the portion of the cost that does not change with the size of the home) associated with these home prices, along with a brief interpretation. The fixed cost is between $☐ and S☐ (Round to the nearest hundred dollars as needed.) Choose the correct interpretation below. OA. The fixed cost is zero. OB. The fixed cost is negative. OC. The fixed cost might be zero, negative, or considerable. OD. The fixed cost is positive.
The accompanying dataset contains the listed prices (in thousands of dollars) and the number of square feet for 28 homes in a neighborhood. The data come from a simple random sample. For the SRM to work, we need to formulate the model in terms of cost per square foot. Use the selling price per square foot as y and the reciprocal of the number of square feet as x. (Note: If you keep track of the dimensions for the slope and intercept, you'll see that one represents fixed costs and the other, variable costs.) Complete parts a through e. Click the icon to view the data table of home prices and sizes. (a) Is the simple regression model a reasonable description of the association between the two variables? In particular, consider the conditions needed for the reliable use of the SRM. ○ A. All the conditions for the SRM are satisfied. OB. The errors are not independent. OC. The residuals are not normal. OD. The association between y and x is not linear. O E. There are obvious lurking variables. OF. The variances of the residuals are significantly different. (b) Give a 95% confidence interval for the fixed cost (the portion of the cost that does not change with the size of the home) associated with these home prices, along with a brief interpretation. The fixed cost is between $☐ and S☐ (Round to the nearest hundred dollars as needed.) Choose the correct interpretation below. OA. The fixed cost is zero. OB. The fixed cost is negative. OC. The fixed cost might be zero, negative, or considerable. OD. The fixed cost is positive.

Big Ideas Math A Bridge To Success Algebra 1: Student Edition 2015
1st Edition
ISBN:9781680331141
Author:HOUGHTON MIFFLIN HARCOURT
Publisher:HOUGHTON MIFFLIN HARCOURT
Chapter11: Data Analysis And Displays
Section: Chapter Questions
Problem 2CT

Related questions
Question
help
Transcribed Image Text:The accompanying dataset contains the listed prices (in thousands of dollars) and the number of square feet for 28 homes in a neighborhood. The data come from a simple random sample.
For the SRM to work, we need to formulate the model in terms of cost per square foot. Use the selling price per square foot as y and the reciprocal of the number of square feet as x. (Note: If
you keep track of the dimensions for the slope and intercept, youl see that one represents fixed costs and the other, variable costs.) Complete parts a through e.
Click the icon to view the data table of home prices and sizes.
(a) Is the simple regression model a reasonable description of the association between the two variables? In particular, consider the conditions needed for the reliable use of the SRM.
O A. All the conditions for the SRM are satisfied.
B. The errors are not independent.
OC. The residuals are not normal.
O D. The association between y and x is not linear.
E. There are obvious lurking variables.
OF. The variances of the residuals are significantiy different.
(b) Give a 95% confidence interval for the fixed cost (the portion of the cost that does not change with the size of the home) associated with these home prices, along with a brief
interpretation.
The fixed cost is between s and s.
(Round to the nearest hundred dollars as needed.)
Choose the correct interpretation below.
A. The fixed cost is zero.
B. The ficed cost is negative.
C. The fixed cost might be zero, negative, or considerable.
O D. The fixed cost is positive.
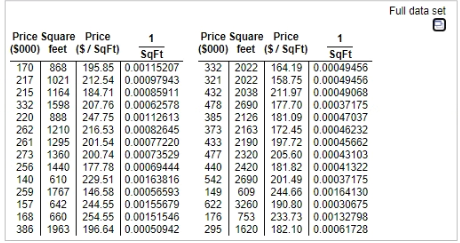
Transcribed Image Text:Full data set
Price Square Price
(S000) feet ($/ Sqft)
Price Square Price
(S000) feet ($/ Sqft)
Sqft
195.85 0.00115207
SqFt
332 2022 164.19 0.00049456
321 2022 158.75 0.00049456
432 2038 211.97 0.00049068
478 2690 177.70 0.00037175
385 2126 181.09 0.00047037
373 2163 172.45 0.00046232
433 2190 197.72 0.00045662
477 2320 205.60 0.00043103
440 | 2420 | 181.82 0.00041322
542 2690 201.49 0.00037175
149
170
868
217
1021 212.540.00097943
215
1164 184.710.00085911
332
1598 207.76 0.00062578
247.75 0.00112613
220
888
262
1210 216.530.00082645
261
1295 201.54 0.00077220
273
1360 200.74 0.00073529
256
1440 177.780.00069444
140
610 229.51 0.00163816
259
1767 146.580.00056593
157
642
660
168
244.55 0.00155679
254.55 0.00151546
609 244.66 0.00164130
622 3260 190.80 0.00030675
176 753 233.73 0.00132798
295
386
1963 | 196.64 |0.00050942
1620 | 182.10 | 0.00061728
Expert Solution
This question has been solved!
Explore an expertly crafted, step-by-step solution for a thorough understanding of key concepts.

This is a popular solution!

Trending now
This is a popular solution!

Step by step
Solved in 4 steps with 14 images

Recommended textbooks for you
Big Ideas Math A Bridge To Success Algebra 1: Stu…
Algebra
ISBN:
9781680331141
Author:
HOUGHTON MIFFLIN HARCOURT
Publisher:
Houghton Mifflin Harcourt

Algebra & Trigonometry with Analytic Geometry
Algebra
ISBN:
9781133382119
Author:
Swokowski
Publisher:
Cengage

Glencoe Algebra 1, Student Edition, 9780079039897…
Algebra
ISBN:
9780079039897
Author:
Carter
Publisher:
McGraw Hill
Big Ideas Math A Bridge To Success Algebra 1: Stu…
Algebra
ISBN:
9781680331141
Author:
HOUGHTON MIFFLIN HARCOURT
Publisher:
Houghton Mifflin Harcourt
Algebra & Trigonometry with Analytic Geometry
Algebra
ISBN:
9781133382119
Author:
Swokowski
Publisher:
Cengage
Glencoe Algebra 1, Student Edition, 9780079039897…
Algebra
ISBN:
9780079039897
Author:
Carter
Publisher:
McGraw Hill

Functions and Change: A Modeling Approach to Coll…
Algebra
ISBN:
9781337111348
Author:
Bruce Crauder, Benny Evans, Alan Noell
Publisher:
Cengage Learning

Linear Algebra: A Modern Introduction
Algebra
ISBN:
9781285463247
Author:
David Poole
Publisher:
Cengage Learning