The accompanying dataset shows the monthly number of new car sales in the last two years. Implement the Holt-Winters multiplicative seasonality model with trend. Find the best combination of a, ẞ, and y to minimize MSE. a=0.2, B=1,y=0.2; a = 0.6, p = 0.4, y = 0.6 Click the icon to view the new car sales data. New Car Sales Data First find the MSE for each set of values, a, ẞ, and (Round to the nearest whole number as needed.) α 0.2 В 1 ➢སྟྲ 0.2 0.6 0.4 0.6 MSE ㅁㅁ Month Period Units Jan 1 39,807 Feb Mar Apr May Jun Jul Aug Sep Oct Nov Dec Jan Feb Mar Apr 23456789TERIO 40,084 47,437 47,300 49,207 51,478 46,466 45,205 44,800 10 46,986 11 42,165 12 44,184 13 42,228 14 45,427 15 54,072 16 50,923 May 17 53,570 Jun 18 54,925 Jul 19 54,452 Aug 20 56,082 Sep 21 52,177 Oct 22 50,087 Nov 23 48,508 Dec 24 49,276
The accompanying dataset shows the monthly number of new car sales in the last two years. Implement the Holt-Winters multiplicative seasonality model with trend. Find the best combination of a, ẞ, and y to minimize MSE. a=0.2, B=1,y=0.2; a = 0.6, p = 0.4, y = 0.6 Click the icon to view the new car sales data. New Car Sales Data First find the MSE for each set of values, a, ẞ, and (Round to the nearest whole number as needed.) α 0.2 В 1 ➢སྟྲ 0.2 0.6 0.4 0.6 MSE ㅁㅁ Month Period Units Jan 1 39,807 Feb Mar Apr May Jun Jul Aug Sep Oct Nov Dec Jan Feb Mar Apr 23456789TERIO 40,084 47,437 47,300 49,207 51,478 46,466 45,205 44,800 10 46,986 11 42,165 12 44,184 13 42,228 14 45,427 15 54,072 16 50,923 May 17 53,570 Jun 18 54,925 Jul 19 54,452 Aug 20 56,082 Sep 21 52,177 Oct 22 50,087 Nov 23 48,508 Dec 24 49,276

Chapter3: Polynomial Functions
Section3.5: Mathematical Modeling And Variation
Problem 1ECP: The ordered pairs below give the median sales prices y (in thousands of dollars) of new homes sold...

Related questions
Question
None
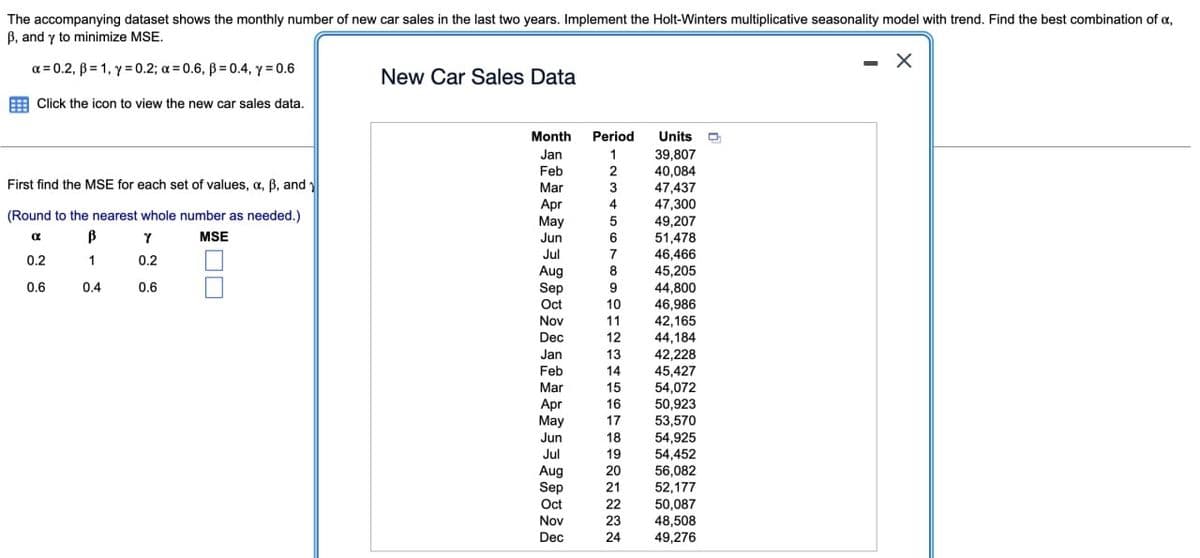
Transcribed Image Text:The accompanying dataset shows the monthly number of new car sales in the last two years. Implement the Holt-Winters multiplicative seasonality model with trend. Find the best combination of a,
ẞ, and y to minimize MSE.
a=0.2, B=1,y=0.2; a = 0.6, p = 0.4, y = 0.6
Click the icon to view the new car sales data.
New Car Sales Data
First find the MSE for each set of values, a, ẞ, and
(Round to the nearest whole number as needed.)
α
0.2
В
1
➢སྟྲ
0.2
0.6
0.4
0.6
MSE
ㅁㅁ
Month
Period
Units
Jan
1
39,807
Feb
Mar
Apr
May
Jun
Jul
Aug
Sep
Oct
Nov
Dec
Jan
Feb
Mar
Apr
23456789TERIO
40,084
47,437
47,300
49,207
51,478
46,466
45,205
44,800
10
46,986
11
42,165
12
44,184
13
42,228
14
45,427
15
54,072
16
50,923
May
17
53,570
Jun
18
54,925
Jul
19
54,452
Aug
20
56,082
Sep
21
52,177
Oct
22
50,087
Nov
23
48,508
Dec
24
49,276
Expert Solution
This question has been solved!
Explore an expertly crafted, step-by-step solution for a thorough understanding of key concepts.

Step by step
Solved in 2 steps

Recommended textbooks for you

Glencoe Algebra 1, Student Edition, 9780079039897…
Algebra
ISBN:
9780079039897
Author:
Carter
Publisher:
McGraw Hill

Algebra & Trigonometry with Analytic Geometry
Algebra
ISBN:
9781133382119
Author:
Swokowski
Publisher:
Cengage
Glencoe Algebra 1, Student Edition, 9780079039897…
Algebra
ISBN:
9780079039897
Author:
Carter
Publisher:
McGraw Hill
Algebra & Trigonometry with Analytic Geometry
Algebra
ISBN:
9781133382119
Author:
Swokowski
Publisher:
Cengage


Functions and Change: A Modeling Approach to Coll…
Algebra
ISBN:
9781337111348
Author:
Bruce Crauder, Benny Evans, Alan Noell
Publisher:
Cengage Learning