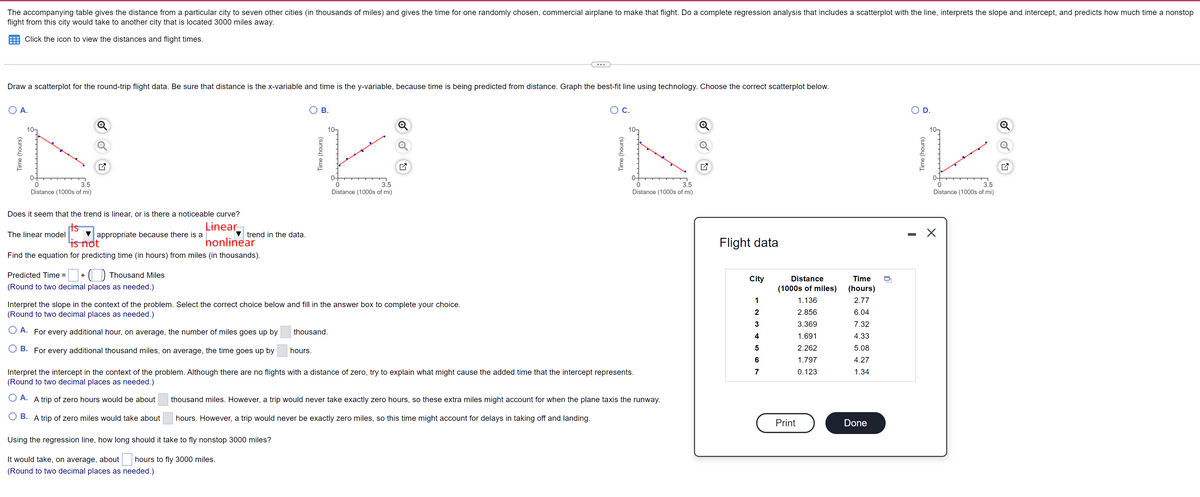
The accompanying table gives the distance from a particular city to seven other cities (in thousands of miles) and gives the time for one randomly chosen, commercial airplane to make that flight. Do a complete regression analysis that includes a scatterplot with the line, interprets the slope and intercept, and predicts how much time a nonstop flight from this city wo
The accompanying table gives the distance from a particular city to seven other cities (in thousands of miles) and gives the time for one randomly chosen, commercial airplane to make that flight. Do a complete regression analysis that includes a scatterplot with the line, interprets the slope and intercept, and predicts how much time a nonstop flight from this city wo

Algebra & Trigonometry with Analytic Geometry
13th Edition
ISBN:9781133382119
Author:Swokowski
Publisher:Swokowski
Chapter7: Analytic Trigonometry
Section7.6: The Inverse Trigonometric Functions
Problem 94E

Related questions
Question
The accompanying table gives the distance from a particular city to seven other cities (in thousands of miles) and gives the time for one randomly chosen, commercial airplane to make that flight. Do a complete
Transcribed Image Text:The accompanying table gives the distance from a particular city to seven other cities (in thousands of miles) and gives the time for one randomly chosen, commercial airplane to make that flight. Do a complete regression analysis that includes a scatterplot with the line, interprets the slope and intercept, and predicts how much time a nonstop
flight from this city would take to another city that is located 3000 miles away.
Click the icon to view the distances and flight times.
Draw a scatterplot for the round-trip flight data. Be sure that distance is the x-variable and time is the y-variable, because time is being predicted from distance. Graph the best-fit line using technology. Choose the correct scatterplot below.
O A.
В.
Oc.
D.
10-
0-
3.5
Distance (1000s of mi)
3.5
Distance (1000s of mi)
3.5
Distance (1000s of mi)
3.5
Distance (1000s of mi)
Does it seem that the trend is linear, or is there a noticeable curve?
Linear
The linear model
appropriate because there is a
trend in the data.
'is not
honlinear
Flight data
Find the equation for predicting time (in hours) from miles (in thousands).
Predicted Time =
) Thousand Miles
+
City
Distance
Time
(Round to two decimal places as needed.)
(1000s of miles)
(hours)
1
1.136
2.77
Interpret the slope in the context of the problem. Select the correct choice below and fill in the answer box to complete your choice.
(Round to two decimal places as needed.)
2
2.856
6.04
3
3.369
7.32
A. For every additional hour, on average, the number of miles goes up by
thousand.
4
1.691
4.33
B. For every additional thousand miles, on average, the time goes up by
hours.
2.262
5.08
6
1.797
4.27
Interpret the intercept in the context of the problem. Although there are no flights with a distance of zero, try to explain what might cause the added time that the intercept represents.
(Round to two decimal places as needed.)
7
0.123
1.34
O A. A trip of zero hours would be about
thousand miles. However, a trip would never take exactly zero hours, so these extra miles might account for when the plane taxis the runway.
В.
A trip of zero miles would take about
hours. However, a trip would never be exactly zero miles, so this time might account for delays in taking off and landing.
Print
Done
Using the regression line, how long should it take to fly nonstop 3000 miles?
It would take, on average, about
hours to fly 3000 miles.
(Round to two decimal places as needed.)
Time (hours)
Time (hours)
Time (hours)
Time (hours)
Expert Solution
This question has been solved!
Explore an expertly crafted, step-by-step solution for a thorough understanding of key concepts.

This is a popular solution!

Trending now
This is a popular solution!

Step by step
Solved in 2 steps with 1 images

Recommended textbooks for you
Algebra & Trigonometry with Analytic Geometry
Algebra
ISBN:
9781133382119
Author:
Swokowski
Publisher:
Cengage

Glencoe Algebra 1, Student Edition, 9780079039897…
Algebra
ISBN:
9780079039897
Author:
Carter
Publisher:
McGraw Hill

Algebra & Trigonometry with Analytic Geometry
Algebra
ISBN:
9781133382119
Author:
Swokowski
Publisher:
Cengage
Glencoe Algebra 1, Student Edition, 9780079039897…
Algebra
ISBN:
9780079039897
Author:
Carter
Publisher:
McGraw Hill

Algebra and Trigonometry (MindTap Course List)
Algebra
ISBN:
9781305071742
Author:
James Stewart, Lothar Redlin, Saleem Watson
Publisher:
Cengage Learning

College Algebra
Algebra
ISBN:
9781305115545
Author:
James Stewart, Lothar Redlin, Saleem Watson
Publisher:
Cengage Learning

Holt Mcdougal Larson Pre-algebra: Student Edition…
Algebra
ISBN:
9780547587776
Author:
HOLT MCDOUGAL
Publisher:
HOLT MCDOUGAL