The accompanying table provides theoretical data on marital status and income bracket for a random sample of adults aged between 20 and 30. Group the bivariate data for the two variables into a contingency table. Click the icon to view the table. UA. Marital Income Bracket Status Low Middle High Total Single 7 6 16 Married 6 13 Separated 2 Divorced 1 Total 36 ANNA 4 2 2 12 15 MOO 3 0 9 43 36
The accompanying table provides theoretical data on marital status and income bracket for a random sample of adults aged between 20 and 30. Group the bivariate data for the two variables into a contingency table. Click the icon to view the table. UA. Marital Income Bracket Status Low Middle High Total Single 7 6 16 Married 6 13 Separated 2 Divorced 1 Total 36 ANNA 4 2 2 12 15 MOO 3 0 9 43 36

Algebra & Trigonometry with Analytic Geometry
13th Edition
ISBN:9781133382119
Author:Swokowski
Publisher:Swokowski
Chapter10: Sequences, Series, And Probability
Section10.2: Arithmetic Sequences
Problem 51E

Related questions
Question
Transcribed Image Text:0
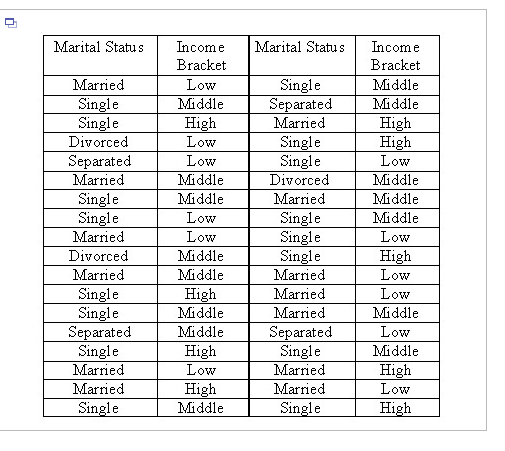
Marital Status
Married
Single
Single
Divorced
Separated
Married
Single
Single
Married
Divorced
Married
Single
Single
Separated
Single
Married
Married
Single
Income
Bracket
Low
Middle
High
Low
Low
Middle
Middle
Low
Low
Middle
Middle
High
Middle
Middle
High
Low
High
Middle
Marital Status
Single
Separated
Married
Single
Single
Divorced
Married
Single
Single
Single
Married
Married
Married.
Separated
Single
Married
Married
Single
Income
Bracket
Middle
Middle
High
High
Low
Middle
Middle
Middle
Low
High
Low
Low
Middle
Low
Middle
High
Low
High
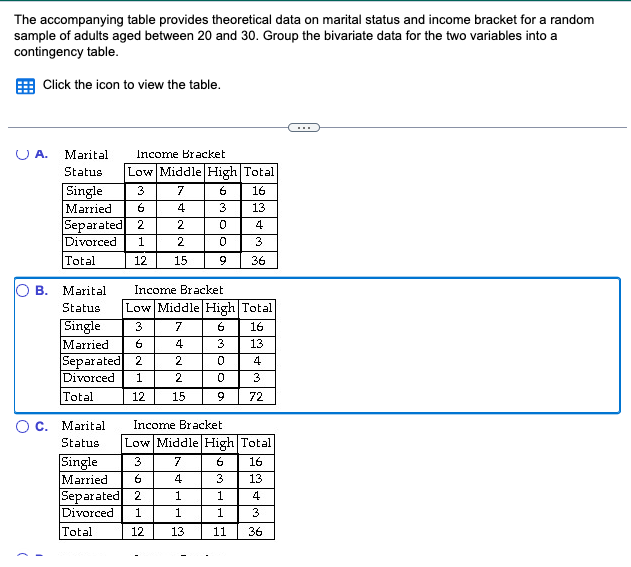
Transcribed Image Text:The accompanying table provides theoretical data on marital status and income bracket for a random
sample of adults aged between 20 and 30. Group the bivariate data for the two variables into a
contingency table.
Click the icon to view the table.
UA. Marital
Income Bracket
Status Low Middle High Total
Single
3
7
Married 6
B.
Separated 2
Divorced 1
Total
4
2
2
12 15
C. Marital
Marital
Income Bracket
Status Low Middle High Total
Single
7
6
3
Married 6
4
Separated 2 2
Divorced 1
2
Total
12 15
6 16
3 13
0
4
0
3
36
9
4
1
1
12 13
Income Bracket
Status Low Middle High Total
Single
3
7
6
16
Married 6
3 13
Separated 2
1
4
Divorced 1
1
3
Total
11 36
16
3 13
0
4
0
3
9 72
Expert Solution
This question has been solved!
Explore an expertly crafted, step-by-step solution for a thorough understanding of key concepts.

Step by step
Solved in 2 steps

Recommended textbooks for you
Algebra & Trigonometry with Analytic Geometry
Algebra
ISBN:
9781133382119
Author:
Swokowski
Publisher:
Cengage
Algebra & Trigonometry with Analytic Geometry
Algebra
ISBN:
9781133382119
Author:
Swokowski
Publisher:
Cengage