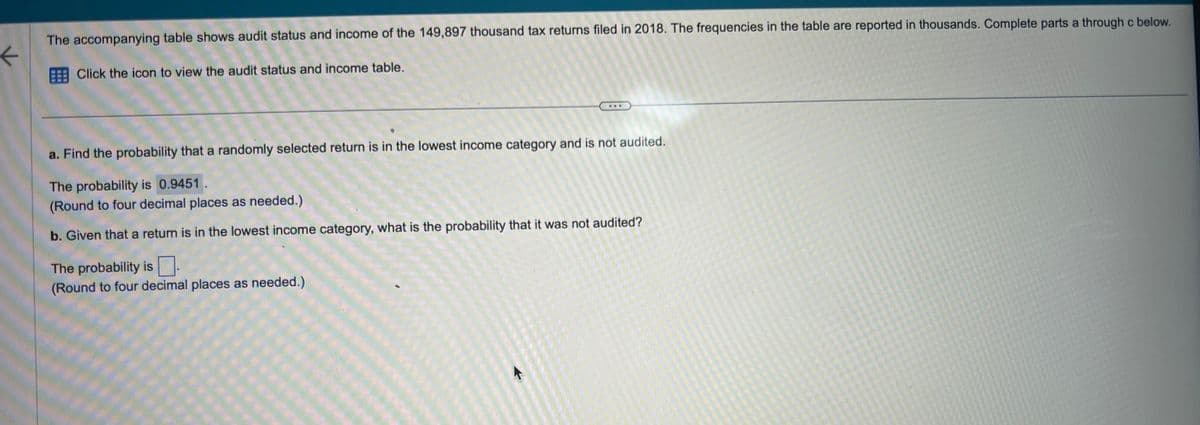
The accompanying table shows audit status and income of the 149,897 thousand tax returns filed in 2018. The frequencies in the table are reported in thousands. Complete parts a through c below. Click the icon to view the audit status and income table. KILE a. Find the probability that a randomly selected return is in the lowest income category and is not audited. The probability is 0.9451. (Round to four decimal places as needed.) b. Given that a return is in the lowest income category, what is the probability that it was not audited? The probability is (Round to four decimal places as needed.)
The accompanying table shows audit status and income of the 149,897 thousand tax returns filed in 2018. The frequencies in the table are reported in thousands. Complete parts a through c below. Click the icon to view the audit status and income table. KILE a. Find the probability that a randomly selected return is in the lowest income category and is not audited. The probability is 0.9451. (Round to four decimal places as needed.) b. Given that a return is in the lowest income category, what is the probability that it was not audited? The probability is (Round to four decimal places as needed.)

Chapter8: Sequences, Series,and Probability
Section8.7: Probability
Problem 35E: Unemployment In 2015, there were approximately 8.3 million unemployed workers in the United States....

Related questions
Question
8.
Transcribed Image Text:K
The accompanying table shows audit status and income of the 149,897 thousand tax returns filed in 2018. The frequencies in the table are reported in thousands. Complete parts a through c below.
Click the icon to view the audit status and income table.
a. Find the probability that a randomly selected return is in the lowest income category and is not audited.
The probability is 0.9451.
(Round to four decimal places as needed.)
b. Given that a return is in the lowest income category, what is the probability that it was not audited?
The probability is
(Round to four decimal places as needed.)
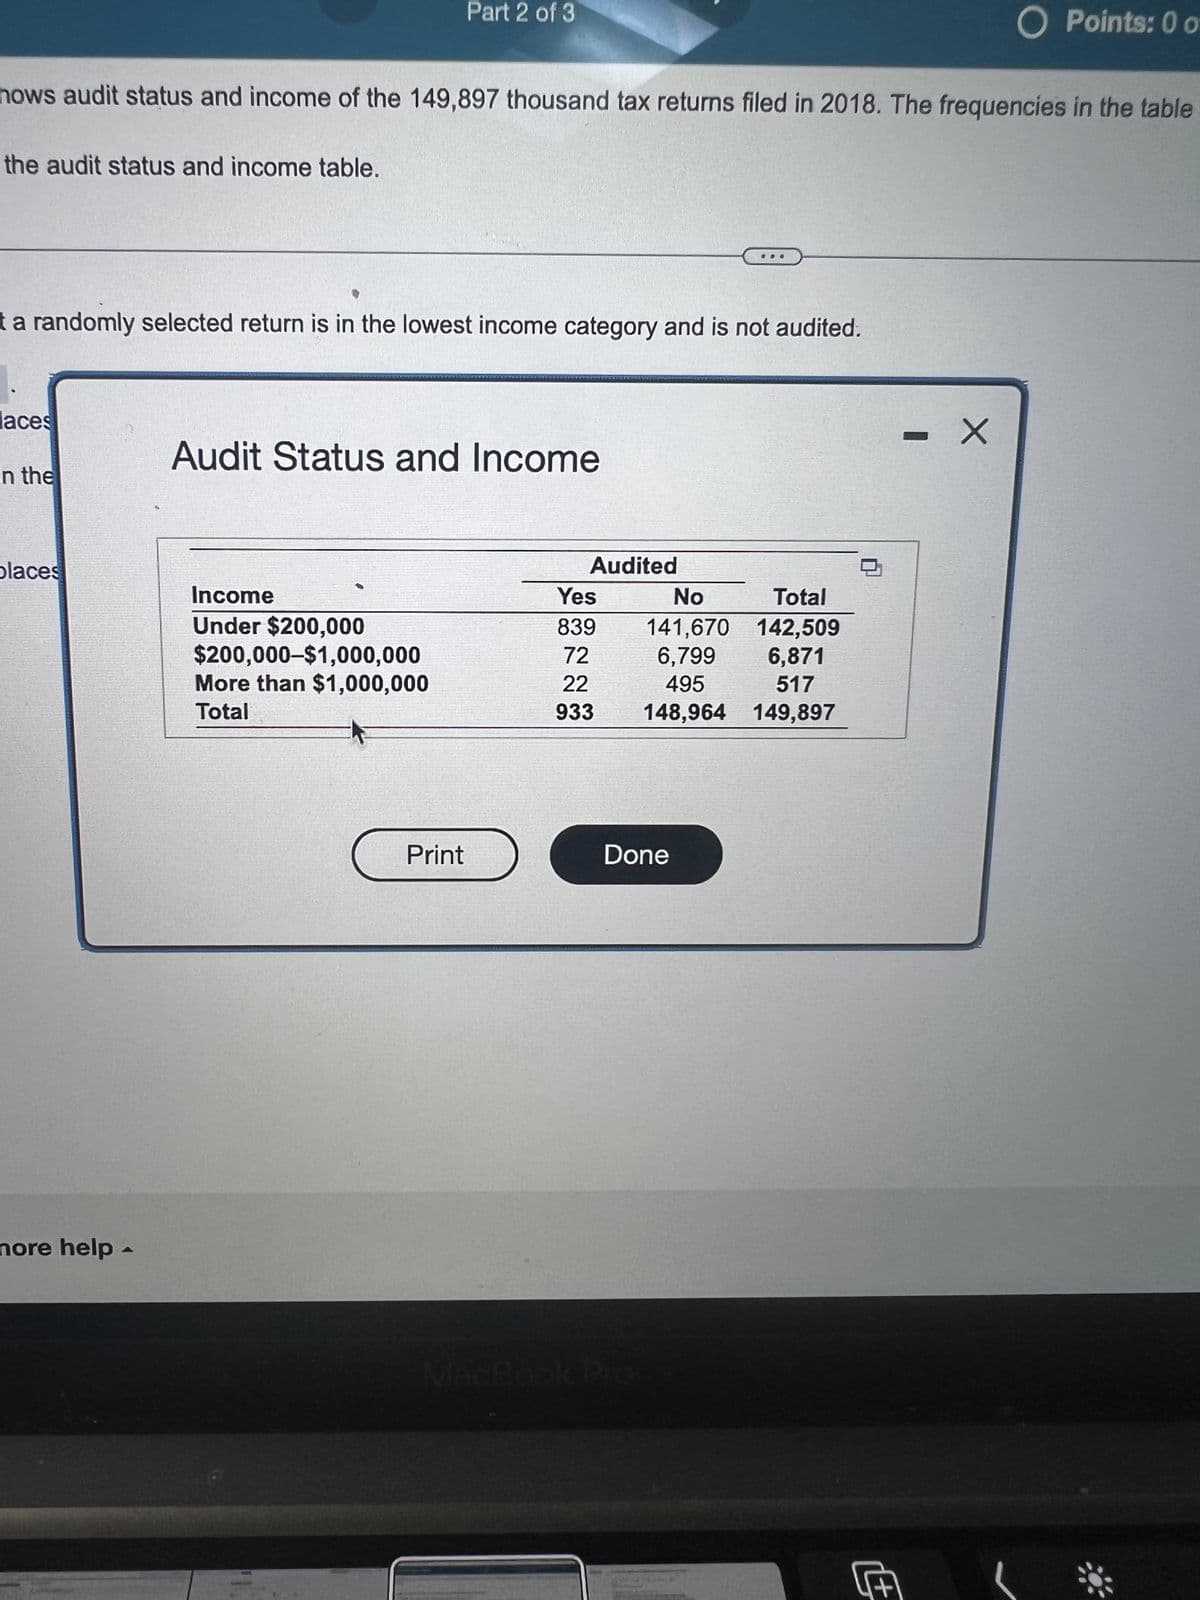
Transcribed Image Text:the audit status and income table.
hows audit status and income of the 149,897 thousand tax returns filed in 2018. The frequencies in the table
t a randomly selected return is in the lowest income category and is not audited.
aces
in the
places
nore help -
Part 2 of 3
Audit Status and Income
Income
Under $200,000
$200,000-$1,000,000
More than $1,000,000
Total
Print
Audited
Yes
No
Total
839
141,670 142,509
72
6,799
6,871
22
517
495
933 148,964
149,897
Done
O Points: 0 o
- X
Expert Solution
This question has been solved!
Explore an expertly crafted, step-by-step solution for a thorough understanding of key concepts.

This is a popular solution!

Trending now
This is a popular solution!

Step by step
Solved in 2 steps

Recommended textbooks for you

Holt Mcdougal Larson Pre-algebra: Student Edition…
Algebra
ISBN:
9780547587776
Author:
HOLT MCDOUGAL
Publisher:
HOLT MCDOUGAL

Glencoe Algebra 1, Student Edition, 9780079039897…
Algebra
ISBN:
9780079039897
Author:
Carter
Publisher:
McGraw Hill
Holt Mcdougal Larson Pre-algebra: Student Edition…
Algebra
ISBN:
9780547587776
Author:
HOLT MCDOUGAL
Publisher:
HOLT MCDOUGAL
Glencoe Algebra 1, Student Edition, 9780079039897…
Algebra
ISBN:
9780079039897
Author:
Carter
Publisher:
McGraw Hill