The accompanying table shows the results of a survey in which 250 male and 250 female workers ages 25 to 64 were asked if they contribute to retirement savings plan at work. Complete parts (a) and (b) below. E Click the icon to view the survey results. (a) Find the probability that a randomly selected worker contributes to a retirement savings plan at work, given that the worker is male. The probability that a randomly selected worker contributes to a retirement savings plan at work, given that the worker is male, is 0.404. (Round to three decimal places as needed.) (Đ) Find the probability that a randomly selected worker is female, given that the worker contributes to a retirement savings plan at work. The probablity that a randomiy seiected worker is female, given that the worker contributes to a retirement savings plan at work, is (Round to three decimal places as needed.) O Survey Results Contribute Do not contribute Total e Male Female 101 149 104 250 250 146 Total 247 253 500
The accompanying table shows the results of a survey in which 250 male and 250 female workers ages 25 to 64 were asked if they contribute to retirement savings plan at work. Complete parts (a) and (b) below. E Click the icon to view the survey results. (a) Find the probability that a randomly selected worker contributes to a retirement savings plan at work, given that the worker is male. The probability that a randomly selected worker contributes to a retirement savings plan at work, given that the worker is male, is 0.404. (Round to three decimal places as needed.) (Đ) Find the probability that a randomly selected worker is female, given that the worker contributes to a retirement savings plan at work. The probablity that a randomiy seiected worker is female, given that the worker contributes to a retirement savings plan at work, is (Round to three decimal places as needed.) O Survey Results Contribute Do not contribute Total e Male Female 101 149 104 250 250 146 Total 247 253 500

College Algebra
7th Edition
ISBN:9781305115545
Author:James Stewart, Lothar Redlin, Saleem Watson
Publisher:James Stewart, Lothar Redlin, Saleem Watson
Chapter9: Counting And Probability
Section9.3: Binomial Probability
Problem 33E: Sick leave probability that a given worker at Dyno Nutrition Will call in sick on a Monday is 004....

Related questions

Concept explainers
Contingency Table
A contingency table can be defined as the visual representation of the relationship between two or more categorical variables that can be evaluated and registered. It is a categorical version of the scatterplot, which is used to investigate the linear relationship between two variables. A contingency table is indeed a type of frequency distribution table that displays two variables at the same time.
Binomial Distribution
Binomial is an algebraic expression of the sum or the difference of two terms. Before knowing about binomial distribution, we must know about the binomial theorem.
Topic Video
Question
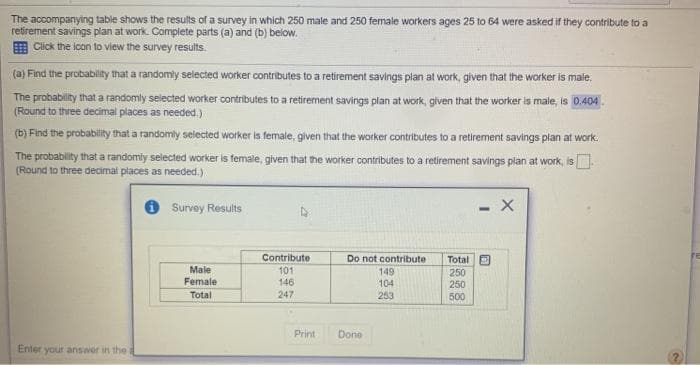
Transcribed Image Text:The accompanying table shows the results of a survey in which 250 male and 250 female workers ages 25 to 64 were asked if they contribute to a
retirement savings plan at work. Complete parts (a) and (b) below.
E Click the icon to view the survey results.
(a) Find the probabilit that a randomly selected worker contributes to a retirement savings plan at work, given that the worker is male,
The probability that a randomly selected worker contributes to a retirement savings plan at work, given that the worker is male, is 0.404
(Round to three decimal places as needed.)
(b) Find the probability that a randomly selected worker is female, given that the worker contributes to a retirement savings plan at work.
The probability that a randomly selected worker is female, given that the worker contributes to a retirement savings plan at work, is .
(Round to three decimal places as needed.)
Survey Results
- X
Total D
Contribute
101
146
247
Do not contribute
Male
149
250
250
Female
104
Total
253
500
Print
Done
Enter your answer in the
Expert Solution
This question has been solved!
Explore an expertly crafted, step-by-step solution for a thorough understanding of key concepts.

This is a popular solution!

Trending now
This is a popular solution!

Step by step
Solved in 3 steps

Knowledge Booster


Learn more about
Need a deep-dive on the concept behind this application? Look no further. Learn more about this topic, statistics and related others by exploring similar questions and additional content below.Recommended textbooks for you
College Algebra
Algebra
ISBN:
9781305115545
Author:
James Stewart, Lothar Redlin, Saleem Watson
Publisher:
Cengage Learning

College Algebra
Algebra
ISBN:
9781305115545
Author:
James Stewart, Lothar Redlin, Saleem Watson
Publisher:
Cengage Learning