The accompanying technology output was obtained by using the paired data consisting of foot lengths (cm) and heights (cm) of a sample of 40 people. Along with the paired sample data, the technology was also given a foot length of 27.2 cm to be used for predicting height. The technology found that there is a linear correlation between height and foot length. If someone has a foot length of 27.2 cm, what is the single value that is the best predicted height for that person? E Click the icon to view the technology output. The single value that is the best predicted height is cm. (Round to the nearest whole number as needed.) Technology Output The regression equation is Height = 67.9+5.69 Foot Length Predictor Coef SE Coef Constant 67.91 11.77 5.77 0.000 Foot Length 5.6915 0.4847 11.74 0.000 S=5.50995 R-Sq= 71.1% R-Sq(adj) = 70.3% Predicted Values for New Observations Fit SE Fit 1 222.719 New Obs 95% CI 95X PI 1.691 (219.206, 226.232) (211.165, 234.273) values of Predictors for New Observations Foot New Obs Length 27.2
The accompanying technology output was obtained by using the paired data consisting of foot lengths (cm) and heights (cm) of a sample of 40 people. Along with the paired sample data, the technology was also given a foot length of 27.2 cm to be used for predicting height. The technology found that there is a linear correlation between height and foot length. If someone has a foot length of 27.2 cm, what is the single value that is the best predicted height for that person? E Click the icon to view the technology output. The single value that is the best predicted height is cm. (Round to the nearest whole number as needed.) Technology Output The regression equation is Height = 67.9+5.69 Foot Length Predictor Coef SE Coef Constant 67.91 11.77 5.77 0.000 Foot Length 5.6915 0.4847 11.74 0.000 S=5.50995 R-Sq= 71.1% R-Sq(adj) = 70.3% Predicted Values for New Observations Fit SE Fit 1 222.719 New Obs 95% CI 95X PI 1.691 (219.206, 226.232) (211.165, 234.273) values of Predictors for New Observations Foot New Obs Length 27.2

Glencoe Algebra 1, Student Edition, 9780079039897, 0079039898, 2018
18th Edition
ISBN:9780079039897
Author:Carter
Publisher:Carter
Chapter10: Statistics
Section10.6: Summarizing Categorical Data
Problem 23PPS

Related questions
Question
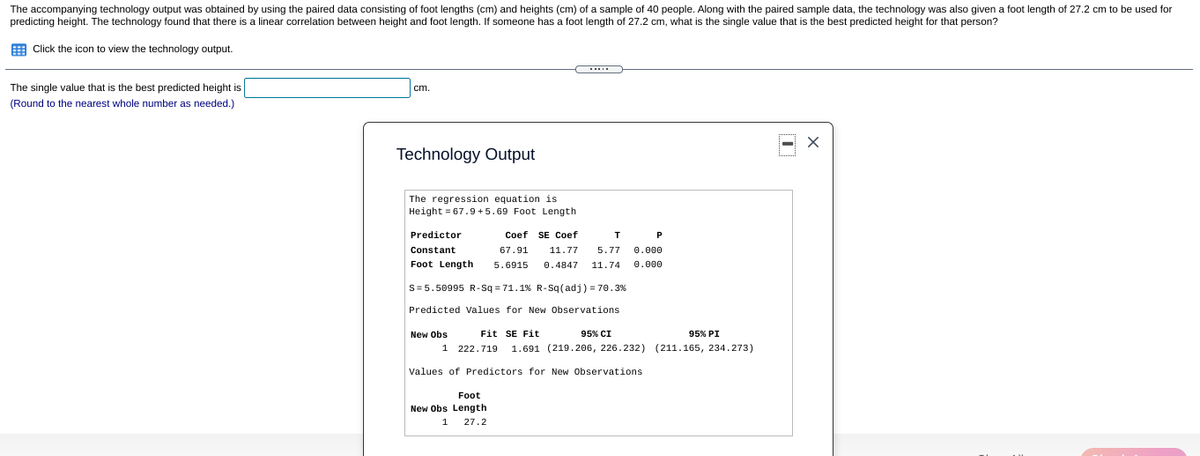
Transcribed Image Text:The accompanying technology output was obtained by using the paired data consisting of foot lengths (cm) and heights (cm) of a sample of 40 people. Along with the paired sample data, the technology was also given a foot length of 27.2 cm to be used for
predicting height. The technology found that there is a linear correlation between height and foot length. If someone has a foot length of 27.2 cm, what is the single value that is the best predicted height for that person?
Click the icon to view the technology output.
The single value that is the best predicted height is
cm
(Round to the nearest whole number as needed.)
Technology Output
The regression equation is
Height = 67.9 +5.69 Foot Length
Predictor
Coef SE Coef
P
Constant
67.91
11.77
5.77
0.000
Foot Length
5.6915
0.4847
11.74
0.000
S=5.50995 R-Sq = 71.1% R-Sq(adj) = 70. 3%
Predicted Values for New Observations
New Obs
Fit SE Fit
95% CI
95% PI
1
222.719
1.691 (219.206, 226.232) (211.165, 234.273)
Values of Predictors for New Observations
Foot
New Obs Length
1
27.2
Expert Solution
This question has been solved!
Explore an expertly crafted, step-by-step solution for a thorough understanding of key concepts.

This is a popular solution!

Trending now
This is a popular solution!

Step by step
Solved in 2 steps with 1 images

Recommended textbooks for you
Glencoe Algebra 1, Student Edition, 9780079039897…
Algebra
ISBN:
9780079039897
Author:
Carter
Publisher:
McGraw Hill

Big Ideas Math A Bridge To Success Algebra 1: Stu…
Algebra
ISBN:
9781680331141
Author:
HOUGHTON MIFFLIN HARCOURT
Publisher:
Houghton Mifflin Harcourt

Holt Mcdougal Larson Pre-algebra: Student Edition…
Algebra
ISBN:
9780547587776
Author:
HOLT MCDOUGAL
Publisher:
HOLT MCDOUGAL
Glencoe Algebra 1, Student Edition, 9780079039897…
Algebra
ISBN:
9780079039897
Author:
Carter
Publisher:
McGraw Hill
Big Ideas Math A Bridge To Success Algebra 1: Stu…
Algebra
ISBN:
9781680331141
Author:
HOUGHTON MIFFLIN HARCOURT
Publisher:
Houghton Mifflin Harcourt
Holt Mcdougal Larson Pre-algebra: Student Edition…
Algebra
ISBN:
9780547587776
Author:
HOLT MCDOUGAL
Publisher:
HOLT MCDOUGAL