The article "The Undrained Strength of Some Thawed Permafrost Soils" contained the accompanying data on the following. y = shear strength of sandy soil (kPa) x₁ = depth (m) x₂ = water content (%) The predicted values and residuals were computed using the estimated regression equation 16.52x₁ + 13.83x₂ + 0.100x3 -0.258x4 + 0.496x5 and x5 = X₁X₂ y = -156.50 where x3 = x₁², x4 = X₂², y X1 14.7 8.8 48.0 36.5 26.9 25.6 36.9 25.8 16.0 6.8 16.8 x2 10.0 6.2 39.2 31.4 39.3 7.0 38.4 20.7 7.4 33.8 38.8 8.3 33.9 16.9 6.4 28.0 24.9 10.0 12.8 27.0 8.1 33.2 16.0 4.4 26.2 37.9 7.3 2.8 34.7 1.9 36.5 Predicted y 22.86 46.10 27.38 11.23 13.47 16.80 23.55 25.24 15.75 24.47 15.19 29.93 15.51 8.00 Residual -8.16 1.90 -1.78 -1.23 2.53 0.00 -2.85 13.56 1.15 2.53 0.81 -5.03 -8.21 4.80 (a) Use the given information to calculate SSResid, SSTO, and SSRegr. (Round your answers to four decimal places.) SSTO= SSResid= SSRegr = (b) Calculate R² for this regression model. (Round your answer to three decimal places.) R² = How would you interpret this value? O The value R² gives the percentage of observed variation in water content that can be explained by the fitted model. O The value R² gives the percentage of observed variation in shear strength of sandy soil that can be explained by the fitted model. O The value R² gives the percentage of water content values in the sample that are equal to the values predicted by the model. O The value R² gives the percentage of shear strength of sandy soil values in the sample that are equal to the values predicted by the model (c) Use the value of R2 from part (b) and a 0.05 level of significance to carry out a model utility F test. Calculate the test statistic. (Round your answer to two decimal places.) F = Use technology to calculate the P-value. (Round your answer to four decimal places.) P-value = What can you conclude? O Reject Ho. We do not have convincing evidence that the multiple regression model is useful. O Fail to reject Ho. We have convincing evidence that the multiple regression model is useful. O Reject H. We have convincing evidence that the multiple regression model is useful. O Fail to reject H. We do not have convincing evidence that the multiple regression model is useful.
The article "The Undrained Strength of Some Thawed Permafrost Soils" contained the accompanying data on the following. y = shear strength of sandy soil (kPa) x₁ = depth (m) x₂ = water content (%) The predicted values and residuals were computed using the estimated regression equation 16.52x₁ + 13.83x₂ + 0.100x3 -0.258x4 + 0.496x5 and x5 = X₁X₂ y = -156.50 where x3 = x₁², x4 = X₂², y X1 14.7 8.8 48.0 36.5 26.9 25.6 36.9 25.8 16.0 6.8 16.8 x2 10.0 6.2 39.2 31.4 39.3 7.0 38.4 20.7 7.4 33.8 38.8 8.3 33.9 16.9 6.4 28.0 24.9 10.0 12.8 27.0 8.1 33.2 16.0 4.4 26.2 37.9 7.3 2.8 34.7 1.9 36.5 Predicted y 22.86 46.10 27.38 11.23 13.47 16.80 23.55 25.24 15.75 24.47 15.19 29.93 15.51 8.00 Residual -8.16 1.90 -1.78 -1.23 2.53 0.00 -2.85 13.56 1.15 2.53 0.81 -5.03 -8.21 4.80 (a) Use the given information to calculate SSResid, SSTO, and SSRegr. (Round your answers to four decimal places.) SSTO= SSResid= SSRegr = (b) Calculate R² for this regression model. (Round your answer to three decimal places.) R² = How would you interpret this value? O The value R² gives the percentage of observed variation in water content that can be explained by the fitted model. O The value R² gives the percentage of observed variation in shear strength of sandy soil that can be explained by the fitted model. O The value R² gives the percentage of water content values in the sample that are equal to the values predicted by the model. O The value R² gives the percentage of shear strength of sandy soil values in the sample that are equal to the values predicted by the model (c) Use the value of R2 from part (b) and a 0.05 level of significance to carry out a model utility F test. Calculate the test statistic. (Round your answer to two decimal places.) F = Use technology to calculate the P-value. (Round your answer to four decimal places.) P-value = What can you conclude? O Reject Ho. We do not have convincing evidence that the multiple regression model is useful. O Fail to reject Ho. We have convincing evidence that the multiple regression model is useful. O Reject H. We have convincing evidence that the multiple regression model is useful. O Fail to reject H. We do not have convincing evidence that the multiple regression model is useful.

College Algebra
7th Edition
ISBN:9781305115545
Author:James Stewart, Lothar Redlin, Saleem Watson
Publisher:James Stewart, Lothar Redlin, Saleem Watson
Chapter1: Equations And Graphs
Section: Chapter Questions
Problem 10T: Olympic Pole Vault The graph in Figure 7 indicates that in recent years the winning Olympic men’s...

Related questions
Question
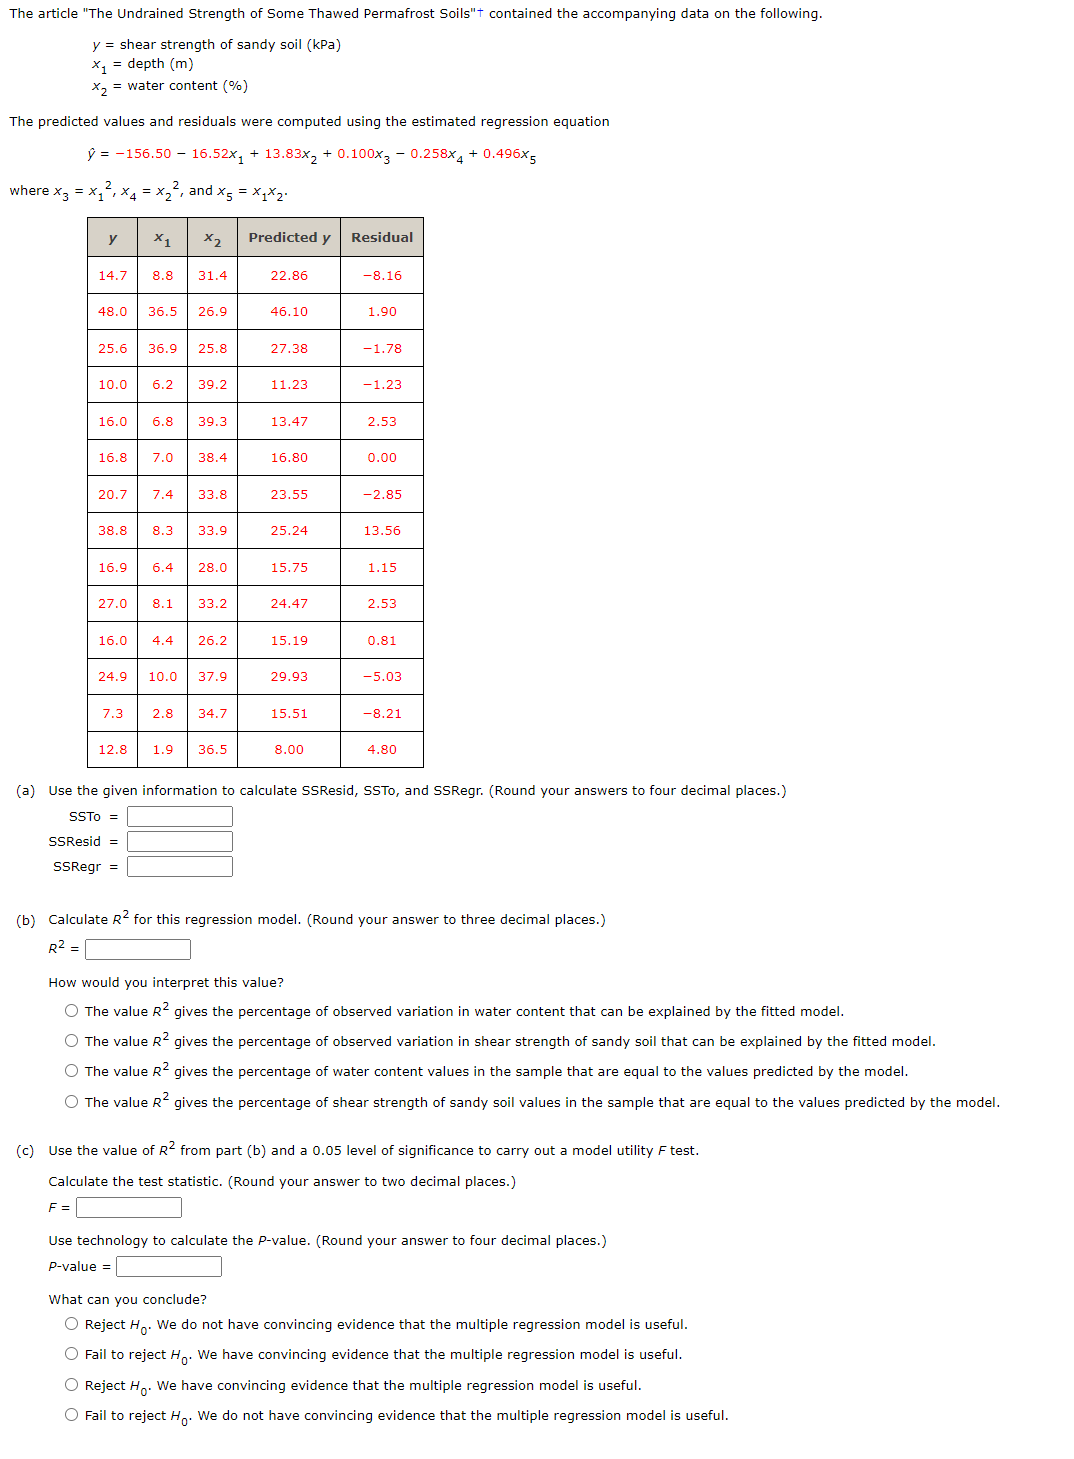
Transcribed Image Text:The article "The Undrained Strength of Some Thawed Permafrost Soils"+ contained the accompanying data on the following.
y = shear strength of sandy soil (kPa)
x₁ = depth (m)
X₂ = water content (%)
The predicted values and residuals were computed using the estimated regression equation
y = -156.50
16.52x₁ + 13.83x₂ + 0.100x30.258x4 + 0.496x5
X1 = X
X4
where X3
y
₂², and x5 = X₁X2
14.7 8.8 31.4
X1
48.0 36.5 26.9
X2
25.6 36.9 25.8
10.0 6.2 39.2
16.0 6.8 39.3
16.8 7.0 38.4
20.7 7.4 33.8
38.8 8.3 33.9
16.9 6.4 28.0
27.0 8.1 33.2
7.3
16.0 4.4 26.2
12.8
24.9 10.0 37.9
SSResid =
SSRegr =
2.8 34.7
1.9 36.5
Predicted y
22.86
46.10
27.38
11.23
13.47
16.80
23.55
25.24
15.75
24.47
15.19
29.93
15.51
8.00
Residual
-8.16
1.90
-1.78
-1.23
2.53
0.00
-2.85
13.56
1.15
2.53
0.81
-5.03
-8.21
4.80
(a) Use the given information to calculate SSResid, SSTO, and SSRegr. (Round your answers to four decimal places.)
SSTO =
(b) Calculate R² for this regression model. (Round your answer to three decimal places.)
R² =
How would you interpret this value?
O The value R² gives the percentage of observed variation in water content that can be explained by the fitted model.
O The value R² gives the percentage of observed variation in shear strength of sandy soil that can be explained by the fitted model.
O The value R² gives the percentage of water content values in the sample that are equal to the values predicted by the model.
O The value R² gives the percentage of shear strength of sandy soil values in the sample that are equal to the values predicted by the model.
(c) Use the value of R² from part (b) and a 0.05 level of significance to carry out a model utility F test.
Calculate the test statistic. (Round your answer to two decimal places.)
F =
Use technology to calculate the P-value. (Round your answer to four decimal places.)
P-value =
What can you conclude?
O Reject Ho. We do not have convincing evidence that the multiple regression model is useful.
O Fail to reject Ho. We have convincing evidence that the multiple regression model is useful.
O Reject Ho. We have convincing evidence that the multiple regression model is useful.
O Fail to reject Ho. We do not have convincing evidence that the multiple regression model is useful.
Expert Solution
This question has been solved!
Explore an expertly crafted, step-by-step solution for a thorough understanding of key concepts.

This is a popular solution!

Trending now
This is a popular solution!

Step by step
Solved in 5 steps

Recommended textbooks for you
College Algebra
Algebra
ISBN:
9781305115545
Author:
James Stewart, Lothar Redlin, Saleem Watson
Publisher:
Cengage Learning
College Algebra
Algebra
ISBN:
9781305115545
Author:
James Stewart, Lothar Redlin, Saleem Watson
Publisher:
Cengage Learning