The assets (in billions of dollars) of the four wealthiest people in a particular country are 38, 27, 26, 17. Assume that samples of sizen=2 are randomly selected with replacement from this population of four values. a. After identifying the 16 different possible samples and finding the mean of each sample, construct a table representing the sampling distribution of the sample mean. In the table, values of the sample mean that are the same have been combined. Probability Probability 38 26.5 32.5 26 32 22 27.5 21.5 27 17 (Type integers or fractions.)
The assets (in billions of dollars) of the four wealthiest people in a particular country are 38, 27, 26, 17. Assume that samples of sizen=2 are randomly selected with replacement from this population of four values. a. After identifying the 16 different possible samples and finding the mean of each sample, construct a table representing the sampling distribution of the sample mean. In the table, values of the sample mean that are the same have been combined. Probability Probability 38 26.5 32.5 26 32 22 27.5 21.5 27 17 (Type integers or fractions.)

College Algebra (MindTap Course List)
12th Edition
ISBN:9781305652231
Author:R. David Gustafson, Jeff Hughes
Publisher:R. David Gustafson, Jeff Hughes
Chapter8: Sequences, Series, And Probability
Section8.7: Probability
Problem 7E: List the sample space of each experiment. Selecting a letter of the alphabet

Related questions

Question
The assets (in billions of dollars) of the four wealthiest people in a particular country are 38, 27, 26, 17.Assume that samples of size n=2 are randomly selected with replacement from this population of four values.
a. After identifying the 16 different possible samples and finding the mean of each sample, construct a table representing the sampling distribution of the sample mean. In the table, values of the sample mean that are the same have been combined.
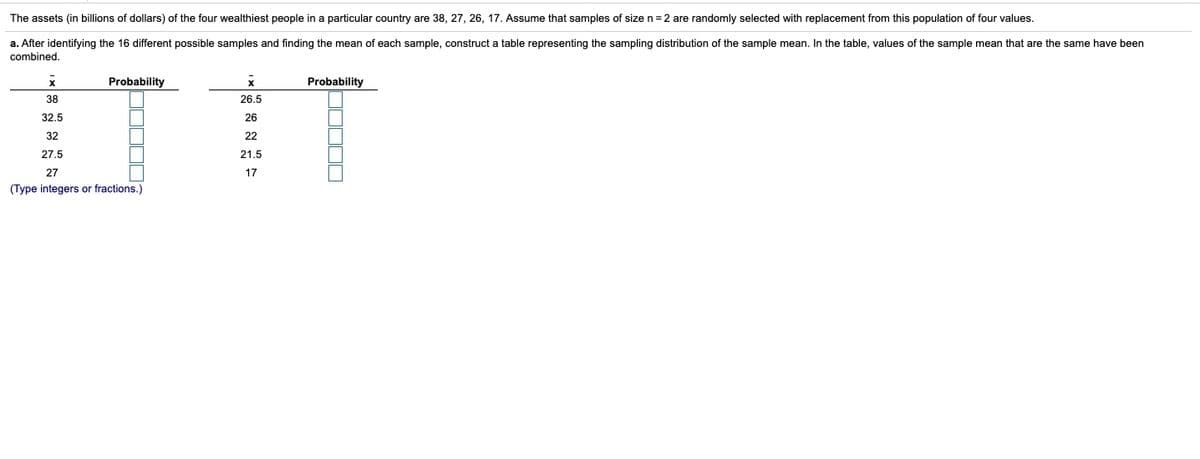
Transcribed Image Text:The assets (in billions of dollars) of the four wealthiest people in a particular country are 38, 27, 26, 17. Assume that samples of size n=2 are randomly selected with replacement from this population of four values.
a. After identifying the 16 different possible samples and finding the mean of each sample, construct a table representing the sampling distribution of the sample mean. In the table, values of the sample mean that are the same have been
combined.
T IT
Probability
Probability
38
26.5
32.5
26
32
22
27.5
21.5
27
17
(Type integers or fractions.)
Expert Solution
This question has been solved!
Explore an expertly crafted, step-by-step solution for a thorough understanding of key concepts.

This is a popular solution!

Trending now
This is a popular solution!

Step by step
Solved in 2 steps with 2 images

Knowledge Booster


Learn more about
Need a deep-dive on the concept behind this application? Look no further. Learn more about this topic, probability and related others by exploring similar questions and additional content below.Recommended textbooks for you
College Algebra (MindTap Course List)
Algebra
ISBN:
9781305652231
Author:
R. David Gustafson, Jeff Hughes
Publisher:
Cengage Learning
College Algebra (MindTap Course List)
Algebra
ISBN:
9781305652231
Author:
R. David Gustafson, Jeff Hughes
Publisher:
Cengage Learning