The authors of the paper "Changes in Quantity, Spending, and Nutritional Characteristics of Adult, Adolescent and Child Urban Corner Store Purchases After an Environmental Intervention"† wondered if increasing the availability of healthy food options would also increase the amount people spend at the corner store. They collected data from a representative sample of 5,949 purchases at corner stores in Philadelphia after the stores increased their healthy food options. The sample mean amount spent for this sample of purchases was $2.86 and the sample standard deviation was $5.40. Find the test statistic and P-value.
The authors of the paper "Changes in Quantity, Spending, and Nutritional Characteristics of Adult, Adolescent and Child Urban Corner Store Purchases After an Environmental Intervention"† wondered if increasing the availability of healthy food options would also increase the amount people spend at the corner store. They collected data from a representative sample of 5,949 purchases at corner stores in Philadelphia after the stores increased their healthy food options. The sample mean amount spent for this sample of purchases was $2.86 and the sample standard deviation was $5.40. Find the test statistic and P-value.

Glencoe Algebra 1, Student Edition, 9780079039897, 0079039898, 2018
18th Edition
ISBN:9780079039897
Author:Carter
Publisher:Carter
Chapter10: Statistics
Section10.3: Measures Of Spread
Problem 1GP

Related questions
Question
The authors of the paper "Changes in Quantity, Spending, and Nutritional Characteristics of Adult, Adolescent and Child Urban Corner Store Purchases After an Environmental Intervention"† wondered if increasing the availability of healthy food options would also increase the amount people spend at the corner store. They collected data from a representative sample of 5,949 purchases at corner stores in Philadelphia after the stores increased their healthy food options. The sample
Find the test statistic and P-value.
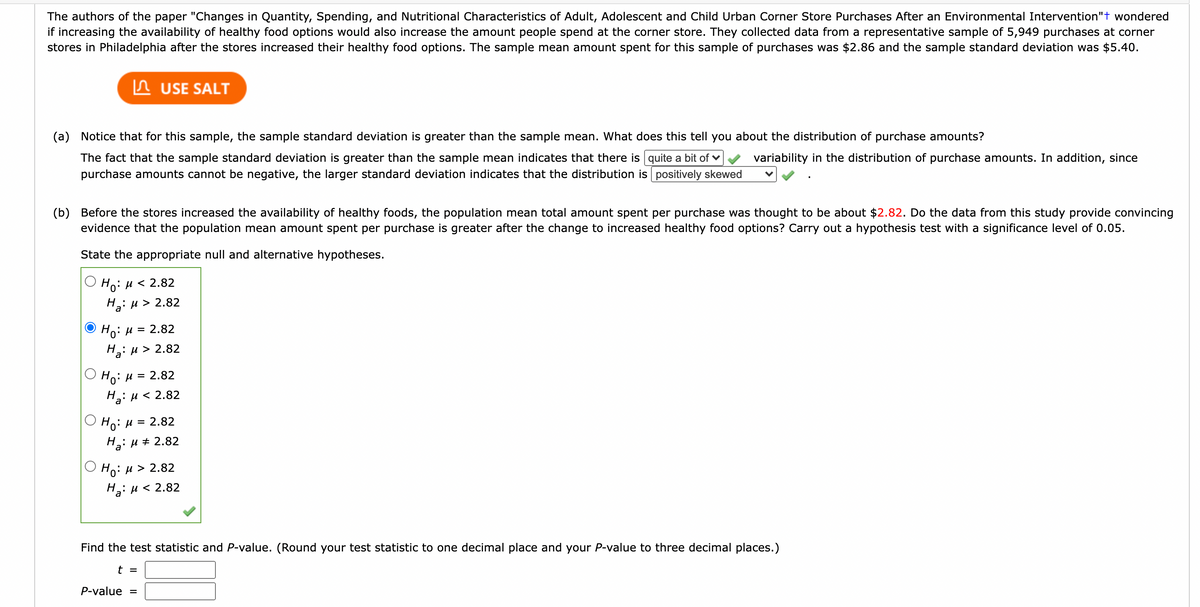
Transcribed Image Text:The authors of the paper "Changes in Quantity, Spending, and Nutritional Characteristics of Adult, Adolescent and Child Urban Corner Store Purchases After an Environmental Intervention"t wondered
if increasing the availability of healthy food options would also increase the amount people spend at the corner store. They collected data from a representative sample of 5,949 purchases at corner
stores in Philadelphia after the stores increased their healthy food options. The sample mean amount spent for this sample of purchases was $2.86 and the sample standard deviation was $5.40.
In USE SALT
(a) Notice that for this sample, the sample standard deviation is greater than the sample mean. What does this tell you about the distribution of purchase amounts?
The fact that the sample standard deviation is greater than the sample mean indicates that there is quite a bit of v
purchase amounts cannot be negative, the larger standard deviation indicates that the distribution is positively skewed
variability in the distribution of purchase amounts. In addition, since
(b) Before the stores increased the availability of healthy foods, the population mean total amount spent per purchase was thought to be about $2.82. Do the data from this study provide convincing
evidence that the population mean amount spent per purchase is greater after the change to increased healthy food options? Carry out a hypothesis test with a significance level of 0.05.
State the appropriate null and alternative hypotheses.
Но: и < 2.82
На: и> 2.82
a
Но: и 3D 2.82
Ha: u > 2.82
Но: и 3D 2.82
Hai u < 2.82
Но: и 3D 2.82
Н: и # 2.82
a
Но: и> 2.82
Н: и < 2.82
a
Find the test statistic and P-value. (Round your test statistic to one decimal place and your P-value to three decimal places.)
t =
P-value =
Expert Solution
This question has been solved!
Explore an expertly crafted, step-by-step solution for a thorough understanding of key concepts.

This is a popular solution!

Trending now
This is a popular solution!

Step by step
Solved in 2 steps with 1 images

Recommended textbooks for you
Glencoe Algebra 1, Student Edition, 9780079039897…
Algebra
ISBN:
9780079039897
Author:
Carter
Publisher:
McGraw Hill
Glencoe Algebra 1, Student Edition, 9780079039897…
Algebra
ISBN:
9780079039897
Author:
Carter
Publisher:
McGraw Hill