The average age at which adolescent girls reach their adult height is 16 years. Suppose you have a sample of 29 adolescent girls who are developmentally delayed, and who have an average age at which they reached their adult height of 17.8 years and a sample variance of 77.4 years. You want to test the hypothesis that adolescent girls who are developmentally delayed have a different age at which they reached their adult height than all adolescent girls. Calculate the t statistic. To do this, you first need to calculate the estimated standard error. The estimated standard error is sM= The t statistic is Now suppose you have a larger sample size n = 91. Calculate the estimated standard error and thet statistic for this sample with the same sample average and the same standard deviation as above, but with the larger sample size. The new estimated standard error is . The new t statistic is Note that thet statistic becomes as n becomes larger.
The average age at which adolescent girls reach their adult height is 16 years. Suppose you have a sample of 29 adolescent girls who are developmentally delayed, and who have an average age at which they reached their adult height of 17.8 years and a sample variance of 77.4 years. You want to test the hypothesis that adolescent girls who are developmentally delayed have a different age at which they reached their adult height than all adolescent girls. Calculate the t statistic. To do this, you first need to calculate the estimated standard error. The estimated standard error is sM= The t statistic is Now suppose you have a larger sample size n = 91. Calculate the estimated standard error and thet statistic for this sample with the same sample average and the same standard deviation as above, but with the larger sample size. The new estimated standard error is . The new t statistic is Note that thet statistic becomes as n becomes larger.

Glencoe Algebra 1, Student Edition, 9780079039897, 0079039898, 2018
18th Edition
ISBN:9780079039897
Author:Carter
Publisher:Carter
Chapter10: Statistics
Section10.1: Measures Of Center
Problem 9PPS

Related questions
Question
Need all questions answered.
Options for last question are:
A) flatter and more spread out
B) more like the z distribution
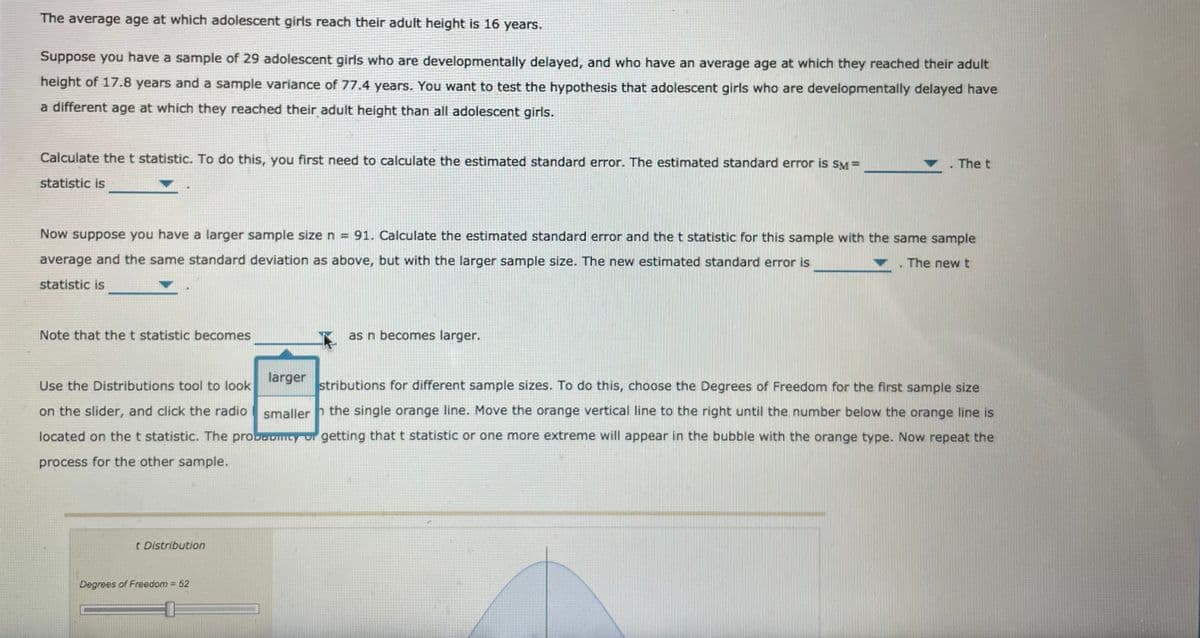
Transcribed Image Text:The average age at which adolescent girls reach their adult height is 16 years.
Suppose you have a sample of 29 adolescent girls who are developmentally delayed, and who have an average age at which they reached their adult
height of 17.8 years and a sample variance of 77.4 years. You want to test the hypothesis that adolescent girls who are developmentally delayed have
a different age at which they reached their adult height than all adolescent girls.
Calculate the t statistic. To do this, you first need to calculate the estimated standard error. The estimated standard error is SM=
The t
statistic is
Now suppose you have a larger sample size n = 91. Calculate the estimated standard error and the t statistic for this sample with the same sample
average and the same standard deviation as above, but with the larger sample size. The new estimated standard error is
The new t
statistic is
Note that the t statistic becomes
as n becomes larger.
larger
Use the Distributions tool to look
stributions for different sample sizes. To do this, choose the Degrees of Freedom for the first sample size
on the slider, and click the radio
smaller h the single orange line. Move the orange vertical line to the right until the number below the orange line is
located on the t statistic. The probovmty ur getting that t statistic or one more extreme will appear in the bubble with the orange type. Now repeat the
process for the other sample.
t Distribution
Degrees of Freedom 52
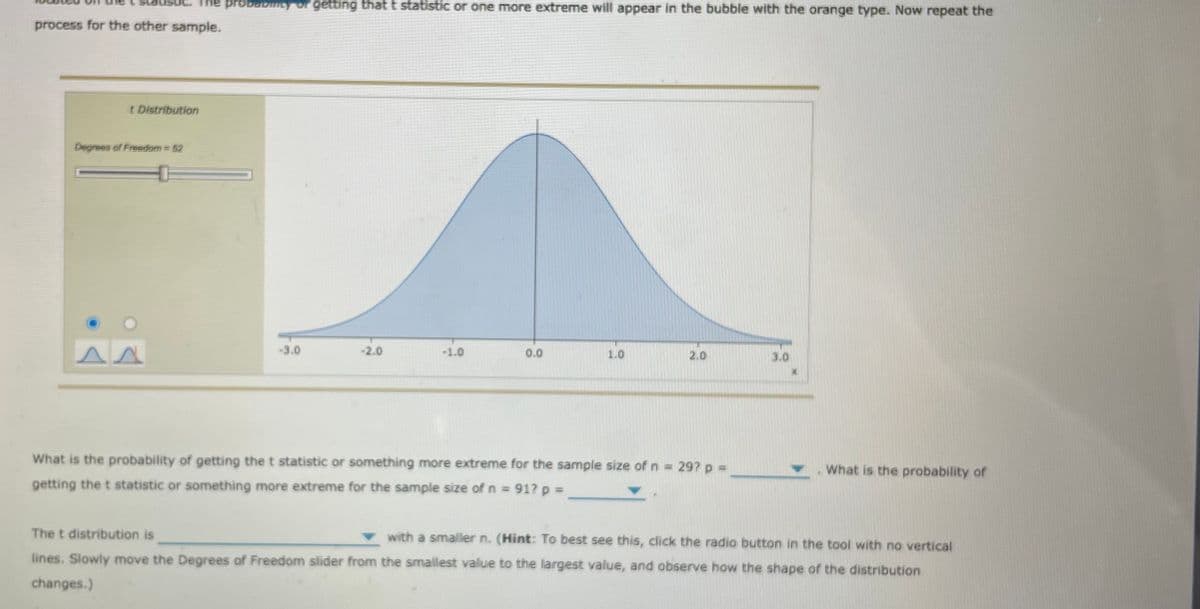
Transcribed Image Text:probabmey or getting that t statistic or one more extreme will appear in the bubble with the orange type. Now repeat the
process for the other sample.
t Distribution
Degrees of Freedom 62
-3.0
-2.0
-1.0
0.0
1.0
2.0
What is the probability of getting the t statistic or something more extreme for the sample size of n = 29? p =
What is the probability of
getting the t statistic or something more extreme for the sample size of n = 91?p3D
The t distribution is
with a smaller n. (Hint: To best see this, click the radio button in the tool with no vertical
lines. Slowly move the Degrees of Freedom slider from the smallest value to the largest value, and observe how the shape of the distribution
changes.)
Expert Solution
This question has been solved!
Explore an expertly crafted, step-by-step solution for a thorough understanding of key concepts.

This is a popular solution!

Trending now
This is a popular solution!

Step by step
Solved in 2 steps

Knowledge Booster


Learn more about
Need a deep-dive on the concept behind this application? Look no further. Learn more about this topic, statistics and related others by exploring similar questions and additional content below.Recommended textbooks for you
Glencoe Algebra 1, Student Edition, 9780079039897…
Algebra
ISBN:
9780079039897
Author:
Carter
Publisher:
McGraw Hill
Glencoe Algebra 1, Student Edition, 9780079039897…
Algebra
ISBN:
9780079039897
Author:
Carter
Publisher:
McGraw Hill