The average wait time to get seated at a popular restaurant in the city on a Friday night is 11 minutes. Is the mean wait time greater for men who wear a tie? Wait times for 15 randomly selected men who were wearing a tie are shown below Assume that the distribution of the population is normal. 11,9,9, 12, 11, 10, 12, 13, 9,9, 11, 13, 12, 9,9 What can be concluded at the the α 0.01 level of significance level of "-? S1 canc a. For this study, we should use Select an answer b. The null and alternative hypotheses would be: C. The test statistic ? ' - please show your answer to 3 decimal places.) d. The p-value = Please show your answer to 4 decimal places.) e. The p-value is?a f Based on this, we should Select an answer g Thus, the final conclusion is that the null hypothesis. The data suggest the populaton mean is significantly more than 11 at a = 0.01, so there is statistically significant evidence to conclude that the population mean wait time for men who wear a tie is more than 11 The data suggest that the population mean wait time for men who wear a tie is not significantly more than 11 at α 0 01, so there is statistically insignificant evidence to conclude that the population mean wait time for men who wear a tie is more than 11 The data suggest the population mean is not significantly more than 11 at a 001, so there is statistically insignificant evidence to conclude that the population mean wait time for men who wear a tie is equal to 11
The average wait time to get seated at a popular restaurant in the city on a Friday night is 11 minutes. Is the mean wait time greater for men who wear a tie? Wait times for 15 randomly selected men who were wearing a tie are shown below Assume that the distribution of the population is normal. 11,9,9, 12, 11, 10, 12, 13, 9,9, 11, 13, 12, 9,9 What can be concluded at the the α 0.01 level of significance level of "-? S1 canc a. For this study, we should use Select an answer b. The null and alternative hypotheses would be: C. The test statistic ? ' - please show your answer to 3 decimal places.) d. The p-value = Please show your answer to 4 decimal places.) e. The p-value is?a f Based on this, we should Select an answer g Thus, the final conclusion is that the null hypothesis. The data suggest the populaton mean is significantly more than 11 at a = 0.01, so there is statistically significant evidence to conclude that the population mean wait time for men who wear a tie is more than 11 The data suggest that the population mean wait time for men who wear a tie is not significantly more than 11 at α 0 01, so there is statistically insignificant evidence to conclude that the population mean wait time for men who wear a tie is more than 11 The data suggest the population mean is not significantly more than 11 at a 001, so there is statistically insignificant evidence to conclude that the population mean wait time for men who wear a tie is equal to 11

Glencoe Algebra 1, Student Edition, 9780079039897, 0079039898, 2018
18th Edition
ISBN:9780079039897
Author:Carter
Publisher:Carter
Chapter10: Statistics
Section10.4: Distributions Of Data
Problem 19PFA

Related questions
Question
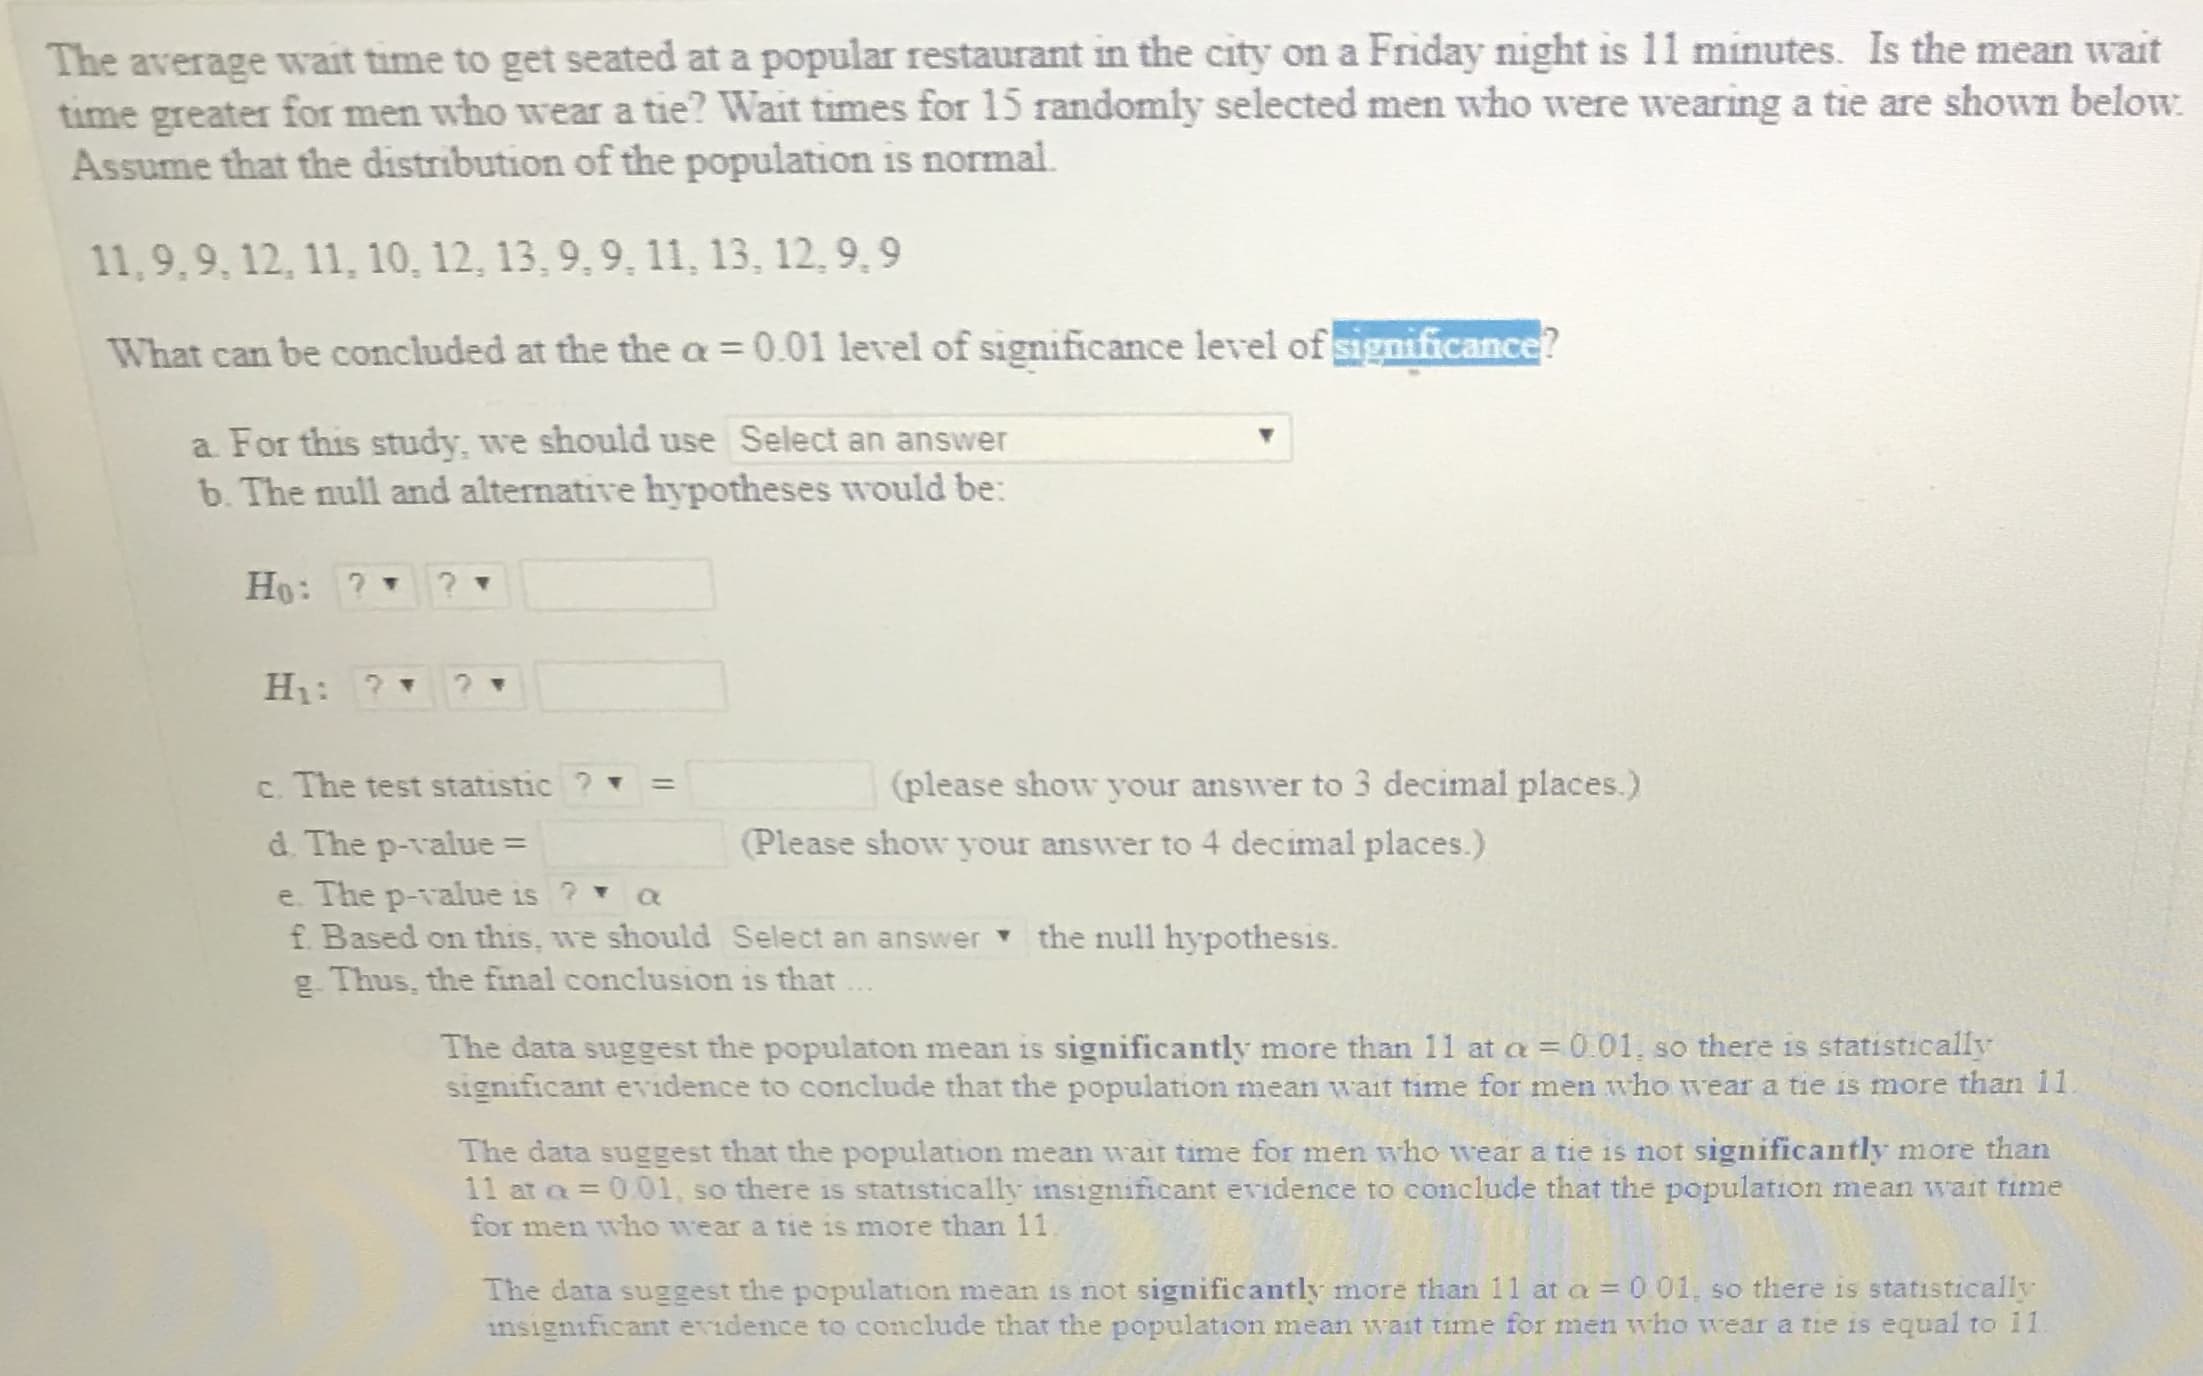
Transcribed Image Text:The average wait time to get seated at a popular restaurant in the city on a Friday night is 11 minutes. Is the mean wait
time greater for men who wear a tie? Wait times for 15 randomly selected men who were wearing a tie are shown below
Assume that the distribution of the population is normal.
11,9,9, 12, 11, 10, 12, 13, 9,9, 11, 13, 12, 9,9
What can be concluded at the the α
0.01 level of significance level of
"-?
S1
canc
a. For this study, we should use Select an answer
b. The null and alternative hypotheses would be:
C. The test statistic ? ' -
please show your answer to 3 decimal places.)
d. The p-value =
Please show your answer to 4 decimal places.)
e. The p-value is?a
f Based on this, we should Select an answer
g Thus, the final conclusion is that
the null hypothesis.
The data suggest the populaton mean is significantly more than 11 at a = 0.01, so there is statistically
significant evidence to conclude that the population mean wait time for men who wear a tie is more than 11
The data suggest that the population mean wait time for men who wear a tie is not significantly more than
11 at α 0 01, so there is statistically insignificant evidence to conclude that the population mean wait time
for men who wear a tie is more than 11
The data suggest the population mean is not significantly more than 11 at a 001, so there is statistically
insignificant evidence to conclude that the population mean wait time for men who wear a tie is equal to 11
Expert Solution
This question has been solved!
Explore an expertly crafted, step-by-step solution for a thorough understanding of key concepts.

This is a popular solution!

Trending now
This is a popular solution!

Step by step
Solved in 7 steps with 2 images

Recommended textbooks for you
Glencoe Algebra 1, Student Edition, 9780079039897…
Algebra
ISBN:
9780079039897
Author:
Carter
Publisher:
McGraw Hill
Glencoe Algebra 1, Student Edition, 9780079039897…
Algebra
ISBN:
9780079039897
Author:
Carter
Publisher:
McGraw Hill