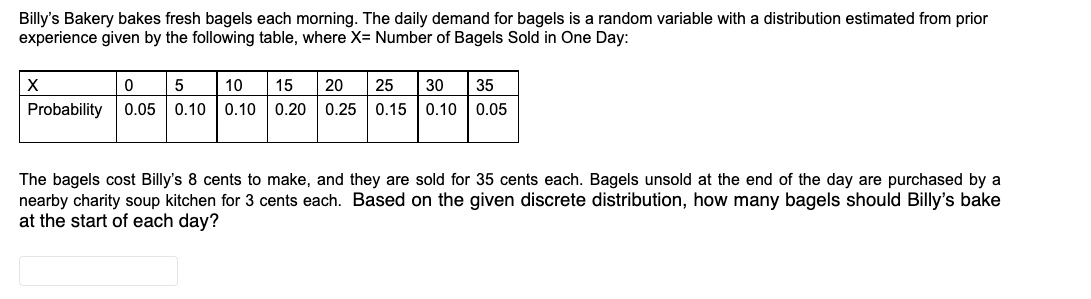
The bagels cost Billy's 8 cents to make, and they are sold for 35 cents each. Bagels unsold at the end of the day are purchased by a hearby charity soup kitchen for 3 cents each. Based on the given discrete distribution, how many bagels should Billy's bake at the start of each day?


Q: The demand for a product of Carolina Industries varies greatly from month to month. Based on the…
A: Given, Unit Demand…
Q: An artist’s supply shop stocks a variety of different items to satisfy the needs of bothamateur and…
A: Given Case Simple EOQ Newsvendor Model with services Level Finite Production rate (Q, R) the…
Q: Consider a hardware supply warehouse that is contractually obligated to deliver 1000 units a…
A: A Small Introduction about Supplier Management Provider the board is the interaction that…
Q: For a company operating 300 days a year, the annual demand is 63,000 units, the lead time is 4…
A: Find the given details below: Given details Demand (D) 63000 Units Inventory Turnover 12…
Q: Vetox sells industrial chemicals. One of their inputs can be purchased in either jugs orbarrels. A…
A: Vetox sells industrial chemicals. One of their inputs can be purchased in either jugs orbarrels. A…
Q: The best quantity to order One of the formulas for inventorymanagement says that the average weekly…
A: Given that; ONne of the formulas for inventorymanagement says that the average weekly cost of…
Q: The children’s buyer needs to average a 51% markup. He needs to purchase 300 dresses that will…
A: x = cost of the dresses in total 51% is the Markup Price Percentage Selling Price = $28,200
Q: If a case of 15 dozen eggs costs $20.45, how much does 1 dozen cost? ___________ How much does 1…
A: Hello thank you for the question. According to the guidelines, we are supposed to provide each…
Q: Lia ITZY has determined that the annual demand for number 6 screws is 100,000 screws. Lia, who works…
A: Given data is Annual demand(D) = 100,000 Order cost(S) = $10 Holding cost = 0.5(0.01) = $0.005
Q: A retailer uses the EOQ model with uncertain demand rate (and positive lead time) to manage the…
A: The question is related to the Inventory Management and EOQ. It is given that D = Annual demand Q =…
Q: How many bagels should the store have at 3 p.m. to maximize the store's expected profit (from sales…
A: A Small Introduction about Demand The request is a financial hypothesis that alludes to a shopper's…
Q: Motorama TV estimates the annual demand for its TVsis (and will be in the future) normally…
A:
Q: Manufacturer produce ‘’furniture’’ receives the ‘rivets’ for furniture whose amount is $100 per…
A: Manufacture refers to the creation or production of goods and services. The job shop manufacturing,…
Q: A phone retailer buys three phone models from the same supplier. The retailer pays per unit cost of…
A: A = Annual usage in units (Demand)S = ordering cost (per order) in dollars or rupeesi = annual…
Q: A jewelry shop procures a ring at $20 each and sells it at $80 each. Weekly demands for the ring…
A: “Since you have posted a question with multiple sub-parts, we will solve first three sub-parts for…
Q: Lia ITZY has determined that the annual demand for number 6 screws is 100,000 screws. Lia, who works…
A: The detailed solution is given in Step 2.
Q: A tire store orders its stock for a popular winter tire once every year. The cost of a tire for the…
A:
Q: 0 Lila Battle has determined that the annual demand for number 6 screws is 100,000 screws. Lila, who…
A:
Q: A company is planning to purchase 10,000 units of a particular item in the year ahead. The item is…
A: Given - Annual Demand = 10,000 units 1 box = 10 units Item price= €400 per box
Q: Stock Code ST1 ST2 ST3 ST4 ST5 ST6 ST7 ST8 Annual Consumption (Piece) 50 130 10 10 150 Unit Price…
A: Find the given details below: Given Details: Stock Code ST1 ST2 ST3 ST4 ST5 ST6 ST7 ST8…
Q: Annual demand for number 2 pencils at the campus store is normallydistributed with mean 1,000 and…
A: Given data Annual Demand = 1000 The standard deviation of Annual Demand = 250 Lead Time = 2 Month…
Q: Annual demand for number 2 pencils at the campus store is normally distributed with mean 1,000 and…
A: Demand D = N (1000, 250) D = 1000standard deviation = 250 unit cost C = 6 cents Selling price S = 20…
Q: A car rental agency uses 96 boxes of staples a The boxes cost $4 each. It costs $10 to order…
A: Given, Annual demand, d =96 boxes Unit cost, u =$4 per box Ordering cost, o =$10 Carrying costs, h…
Q: 1. M Cafe located in Adliya requires 3,000 pcs of pizza dough every quarter. They are spending BD 50…
A: Since you have submitted multiple questions, as per guideline we have answered the first question…
Q: The store wishes to determine the selling price that maximizes revenue for these two products.…
A: Revenue is the total income that is derived from the normal operations and activities of a company.
Q: A manufacturer of a seasonal product faces the following demand for the four quarters of the year…
A: Level plan: A level plan produces a constant level of the production irrespective of demand. It uses…
Q: 3. Cynthia Knott’s oyster bar buys fresh Louisiana oysters for $5 per pound and sells them for…
A: Note: - For a multiple subparts question we can answer only up to three subparts. So we will answer…
Q: • The batteries cost R400 each. • Sales volumes are constant at 600 batteries per month. • The lead…
A: Given- Cost of 1 battery (C) = R400 Annual Demand (D) = 600 X 12 = 7200 Batteries Order cost (S) = R…
Q: The home appliance department in a large department store is using a (Q, R) system to control the…
A: Given data: Radios selling each week = 12 Weekly demand of normal distribution ,variance = 30…
Q: A newsvendor orders 8000 units. Demand is normally distributed with a mean of9000 and a standard…
A: Stockout probability is the likelihood which has insufficient inventory is available to fulfil the…
Q: Marigold Corp. sells 2,750 dim-night bulbs per year, and places orders for 670 of these bulbs at a…
A: To calculate the safety stock,first have to calculate no: of order Marigold estimates a 60% chance…
Q: An artist’s supply shop stocks a variety of different items to satisfy the needs of bothamateur and…
A: Economic order quantity (EOQ) is the optimum purchase quantity of an item at a single point during a…
Q: Gyona purchases meat from the local supermarket at $5 per kilo and sell it at $9 per kilo. any…
A: Given that: selling price SP 9 PURCHASE COST FOR RETAILER PC 5 DISPOSAL COST S 2
Q: An artist’s supply shop stocks a variety of different items to satisfy the needs of bothamateur and…
A: Economic order quantity (EOQ) is the optimum purchase quantity of an item at a single point during a…
Q: A jewelry shop procures a ring at $20 each and sells it at $80 each. Weekly demands for the ring…
A:
Q: Richardson Ski Racing (RSR) sells equipment needed for downhill ski racing. One of RSR's products is…
A: Given, 1 100 215 101 200 195 201 400 175 401 and up 155
Q: Annual demand for a product is normally distributed with mean 2300 units and standard deviation 150…
A: Given, Lead time=4 weeks 1year=52 weeks Standard deviation 150 units Mean 2300 units
Q: Cynthia Knott's oyster bar buys fresh Louisiana oysters for $5 per pound and sells them for $10 per…
A:
Q: Cynthia Knott's oyster bar buys fresh Louisiana oysters for $3 per pound and sells them for $9 per…
A: Given data; Cost price 3 $ per pound Selling price 9 $ per pound Salvage price 2 $ per…
Q: A company wants to develop a level production plan for a family of products. Theopening inventory is…
A: • Inventory: Inventory speaks to the resources like: crude materials, work-in-process products,…
Q: A food processor purchases corn for use in its products. The firm uses 700 pounds of corn per week…
A: Optimal order quantity is the quantity that company should purchase so that their total inventory…
Q: A printing company anticipates using 40,000 reams of paper at a uniform rate over the next year.…
A: EOQ is the economic order quantity that the company should purchase every time they order so that…
Q: a. What penalty is the company incurring by its present order size? b. The manager would prefer…
A: Economic order quantity is the optimal quantity that the business needs to buy the inventory to…
Q: Find the mean and standard deviation for demand. 3b. Based on the information in problems 3 and 3a,…
A: THE ANSWER IS AS BELOW:
Q: Mamma Temte bakes six pies a day that cost $2 each to produce. On 31% of the days she sells only two…
A: Given data is No. of pies baked per day = 6 Cost to produce = $2 Pies sold on 31% of the days = 2…
Q: Nutmeg Inc. uses the LIFO method to account for inventory. During years in whichinventory unit costs…
A: The LIFO method is a method of accounting for inventory. Under this method the last purchase of the…
Q: Annual demand for number 2 pencils at the campus store is normallydistributed with mean 1,000 and…
A: Let, Decision variables are Q, R system Order Quantity = Q Reorder Point = R In the lot size cost…
Q: An artist’s supply shop stocks a variety of different items to satisfy the needs of bothamateur and…
A: Given data, East Coast supplier charging $1.60 under the order 100 East Coast supplier charges…


Trending now
This is a popular solution!

Step by step
Solved in 2 steps

- Assume that all of a companys job applicants must take a test, and that the scores on this test are normally distributed. The selection ratio is the cutoff point used by the company in its hiring process. For example, a selection ratio of 25% means that the company will accept applicants for jobs who rank in the top 25% of all applicants. If the company chooses a selection ratio of 25%, the average test score of those selected will be 1.27 standard deviations above average. Use simulation to verify this fact, proceeding as follows. a. Show that if the company wants to accept only the top 25% of all applicants, it should accept applicants whose test scores are at least 0.674 standard deviation above average. (No simulation is required here. Just use the appropriate Excel normal function.) b. Now generate 1000 test scores from a normal distribution with mean 0 and standard deviation 1. The average test score of those selected is the average of the scores that are at least 0.674. To determine this, use Excels DAVERAGE function. To do so, put the heading Score in cell A3, generate the 1000 test scores in the range A4:A1003, and name the range A3:A1003 Data. In cells C3 and C4, enter the labels Score and 0.674. (The range C3:C4 is called the criterion range.) Then calculate the average of all applicants who will be hired by entering the formula =DAVERAGE(Data, "Score", C3:C4) in any cell. This average should be close to the theoretical average, 1.27. This formula works as follows. Excel finds all observations in the Data range that satisfy the criterion described in the range C3:C4 (Score0.674). Then it averages the values in the Score column (the second argument of DAVERAGE) corresponding to these entries. See online help for more about Excels database D functions. c. What information would the company need to determine an optimal selection ratio? How could it determine the optimal selection ratio?Six months before its annual convention, the American Medical Association must determine how many rooms to reserve. At this time, the AMA can reserve rooms at a cost of 150 per room. The AMA believes the number of doctors attending the convention will be normally distributed with a mean of 5000 and a standard deviation of 1000. If the number of people attending the convention exceeds the number of rooms reserved, extra rooms must be reserved at a cost of 250 per room. a. Use simulation with @RISK to determine the number of rooms that should be reserved to minimize the expected cost to the AMA. Try possible values from 4100 to 4900 in increments of 100. b. Redo part a for the case where the number attending has a triangular distribution with minimum value 2000, maximum value 7000, and most likely value 5000. Does this change the substantive results from part a?Assume the demand for a companys drug Wozac during the current year is 50,000, and assume demand will grow at 5% a year. If the company builds a plant that can produce x units of Wozac per year, it will cost 16x. Each unit of Wozac is sold for 3. Each unit of Wozac produced incurs a variable production cost of 0.20. It costs 0.40 per year to operate a unit of capacity. Determine how large a Wozac plant the company should build to maximize its expected profit over the next 10 years.
- An automobile manufacturer is considering whether to introduce a new model called the Racer. The profitability of the Racer depends on the following factors: The fixed cost of developing the Racer is triangularly distributed with parameters 3, 4, and 5, all in billions. Year 1 sales are normally distributed with mean 200,000 and standard deviation 50,000. Year 2 sales are normally distributed with mean equal to actual year 1 sales and standard deviation 50,000. Year 3 sales are normally distributed with mean equal to actual year 2 sales and standard deviation 50,000. The selling price in year 1 is 25,000. The year 2 selling price will be 1.05[year 1 price + 50 (% diff1)] where % diff1 is the number of percentage points by which actual year 1 sales differ from expected year 1 sales. The 1.05 factor accounts for inflation. For example, if the year 1 sales figure is 180,000, which is 10 percentage points below the expected year 1 sales, then the year 2 price will be 1.05[25,000 + 50( 10)] = 25,725. Similarly, the year 3 price will be 1.05[year 2 price + 50(% diff2)] where % diff2 is the percentage by which actual year 2 sales differ from expected year 2 sales. The variable cost in year 1 is triangularly distributed with parameters 10,000, 12,000, and 15,000, and it is assumed to increase by 5% each year. Your goal is to estimate the NPV of the new car during its first three years. Assume that the company is able to produce exactly as many cars as it can sell. Also, assume that cash flows are discounted at 10%. Simulate 1000 trials to estimate the mean and standard deviation of the NPV for the first three years of sales. Also, determine an interval such that you are 95% certain that the NPV of the Racer during its first three years of operation will be within this interval.A common decision is whether a company should buy equipment and produce a product in house or outsource production to another company. If sales volume is high enough, then by producing in house, the savings on unit costs will cover the fixed cost of the equipment. Suppose a company must make such a decision for a four-year time horizon, given the following data. Use simulation to estimate the probability that producing in house is better than outsourcing. If the company outsources production, it will have to purchase the product from the manufacturer for 25 per unit. This unit cost will remain constant for the next four years. The company will sell the product for 42 per unit. This price will remain constant for the next four years. If the company produces the product in house, it must buy a 500,000 machine that is depreciated on a straight-line basis over four years, and its cost of production will be 9 per unit. This unit cost will remain constant for the next four years. The demand in year 1 has a worst case of 10,000 units, a most likely case of 14,000 units, and a best case of 16,000 units. The average annual growth in demand for years 2-4 has a worst case of 7%, a most likely case of 15%, and a best case of 20%. Whatever this annual growth is, it will be the same in each of the years. The tax rate is 35%. Cash flows are discounted at 8% per year.You are considering a 10-year investment project. At present, the expected cash flow each year is 10,000. Suppose, however, that each years cash flow is normally distributed with mean equal to last years actual cash flow and standard deviation 1000. For example, suppose that the actual cash flow in year 1 is 12,000. Then year 2 cash flow is normal with mean 12,000 and standard deviation 1000. Also, at the end of year 1, your best guess is that each later years expected cash flow will be 12,000. a. Estimate the mean and standard deviation of the NPV of this project. Assume that cash flows are discounted at a rate of 10% per year. b. Now assume that the project has an abandonment option. At the end of each year you can abandon the project for the value given in the file P11_60.xlsx. For example, suppose that year 1 cash flow is 4000. Then at the end of year 1, you expect cash flow for each remaining year to be 4000. This has an NPV of less than 62,000, so you should abandon the project and collect 62,000 at the end of year 1. Estimate the mean and standard deviation of the project with the abandonment option. How much would you pay for the abandonment option? (Hint: You can abandon a project at most once. So in year 5, for example, you abandon only if the sum of future expected NPVs is less than the year 5 abandonment value and the project has not yet been abandoned. Also, once you abandon the project, the actual cash flows for future years are zero. So in this case the future cash flows after abandonment should be zero in your model.)
- Although the normal distribution is a reasonable input distribution in many situations, it does have two potential drawbacks: (1) it allows negative values, even though they may be extremely improbable, and (2) it is a symmetric distribution. Many situations are modelled better with a distribution that allows only positive values and is skewed to the right. Two of these that have been used in many real applications are the gamma and lognormal distributions. @RISK enables you to generate observations from each of these distributions. The @RISK function for the gamma distribution is RISKGAMMA, and it takes two arguments, as in =RISKGAMMA(3,10). The first argument, which must be positive, determines the shape. The smaller it is, the more skewed the distribution is to the right; the larger it is, the more symmetric the distribution is. The second argument determines the scale, in the sense that the product of it and the first argument equals the mean of the distribution. (The mean in this example is 30.) Also, the product of the second argument and the square root of the first argument is the standard deviation of the distribution. (In this example, it is 3(10=17.32.) The @RISK function for the lognormal distribution is RISKLOGNORM. It has two arguments, as in =RISKLOGNORM(40,10). These arguments are the mean and standard deviation of the distribution. Rework Example 10.2 for the following demand distributions. Do the simulated outputs have any different qualitative properties with these skewed distributions than with the triangular distribution used in the example? a. Gamma distribution with parameters 2 and 85 b. Gamma distribution with parameters 5 and 35 c. Lognormal distribution with mean 170 and standard deviation 60Suppose you have invested 25% of your portfolio in four different stocks. The mean and standard deviation of the annual return on each stock are shown in the file P11_46.xlsx. The correlations between the annual returns on the four stocks are also shown in this file. a. What is the probability that your portfolios annual return will exceed 30%? b. What is the probability that your portfolio will lose money during the year?Referring to Example 11.1, if the average bid for each competitor stays the same, but their bids exhibit less variability, does Millers optimal bid increase or decrease? To study this question, assume that each competitors bid, expressed as a multiple of Millers cost to complete the project, follows each of the following distributions. a. Triangular with parameters 1.0, 1.3, and 2.4 b. Triangular with parameters 1.2, 1.3, and 2.2 c. Use @RISKs Define Distributions window to check that the distributions in parts a and b have the same mean as the original triangular distribution in the example, but smaller standard deviations. What is the common mean? Why is it not the same as the most likely value, 1.3?
- A company manufacturers a product in the United States and sells it in England. The unit cost of manufacturing is 50. The current exchange rate (dollars per pound) is 1.221. The demand function, which indicates how many units the company can sell in England as a function of price (in pounds) is of the power type, with constant 27556759 and exponent 2.4. a. Develop a model for the companys profit (in dollars) as a function of the price it charges (in pounds). Then use a data table to find the profit-maximizing price to the nearest pound. b. If the exchange rate varies from its current value, does the profit-maximizing price increase or decrease? Does the maximum profit increase or decrease?W. L. Brown, a direct marketer of womens clothing, must determine how many telephone operators to schedule during each part of the day. W. L. Brown estimates that the number of phone calls received each hour of a typical eight-hour shift can be described by the probability distribution in the file P10_33.xlsx. Each operator can handle 15 calls per hour and costs the company 20 per hour. Each phone call that is not handled is assumed to cost the company 6 in lost profit. Considering the options of employing 6, 8, 10, 12, 14, or 16 operators, use simulation to determine the number of operators that minimizes the expected hourly cost (labor costs plus lost profits).Play Things is developing a new Lady Gaga doll. The company has made the following assumptions: The doll will sell for a random number of years from 1 to 10. Each of these 10 possibilities is equally likely. At the beginning of year 1, the potential market for the doll is two million. The potential market grows by an average of 4% per year. The company is 95% sure that the growth in the potential market during any year will be between 2.5% and 5.5%. It uses a normal distribution to model this. The company believes its share of the potential market during year 1 will be at worst 30%, most likely 50%, and at best 60%. It uses a triangular distribution to model this. The variable cost of producing a doll during year 1 has a triangular distribution with parameters 15, 17, and 20. The current selling price is 45. Each year, the variable cost of producing the doll will increase by an amount that is triangularly distributed with parameters 2.5%, 3%, and 3.5%. You can assume that once this change is generated, it will be the same for each year. You can also assume that the company will change its selling price by the same percentage each year. The fixed cost of developing the doll (which is incurred right away, at time 0) has a triangular distribution with parameters 5 million, 7.5 million, and 12 million. Right now there is one competitor in the market. During each year that begins with four or fewer competitors, there is a 25% chance that a new competitor will enter the market. Year t sales (for t 1) are determined as follows. Suppose that at the end of year t 1, n competitors are present (including Play Things). Then during year t, a fraction 0.9 0.1n of the company's loyal customers (last year's purchasers) will buy a doll from Play Things this year, and a fraction 0.2 0.04n of customers currently in the market ho did not purchase a doll last year will purchase a doll from Play Things this year. Adding these two provides the mean sales for this year. Then the actual sales this year is normally distributed with this mean and standard deviation equal to 7.5% of the mean. a. Use @RISK to estimate the expected NPV of this project. b. Use the percentiles in @ RISKs output to find an interval such that you are 95% certain that the companys actual NPV will be within this interval.