The bar graphs below show the percentage of students who received each score on their last English paper and Math test. Determine whether each graph has a larger or smaller standard deviation. 40+ 35 30- 25 20- 15- Select an answer 10- 5- 60 70 80 90 Math Score 40- 30- 20- Select an answer 10- 70 80 on
The bar graphs below show the percentage of students who received each score on their last English paper and Math test. Determine whether each graph has a larger or smaller standard deviation. 40+ 35 30- 25 20- 15- Select an answer 10- 5- 60 70 80 90 Math Score 40- 30- 20- Select an answer 10- 70 80 on

Big Ideas Math A Bridge To Success Algebra 1: Student Edition 2015
1st Edition
ISBN:9781680331141
Author:HOUGHTON MIFFLIN HARCOURT
Publisher:HOUGHTON MIFFLIN HARCOURT
Chapter9: Solving Quadratic Functions
Section: Chapter Questions
Problem 4CA

Related questions
Question
19
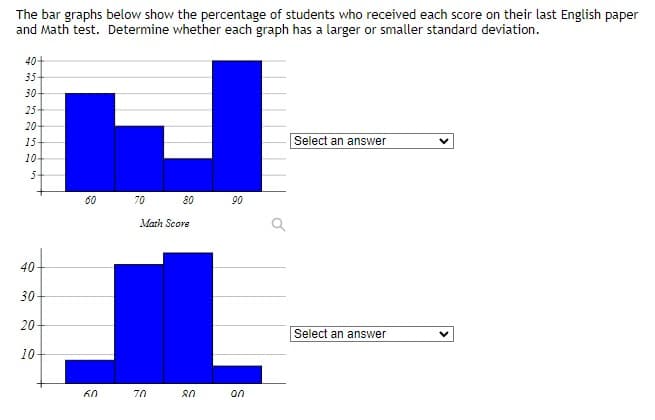
Transcribed Image Text:The bar graphs below show the percentage of students who received each score on their last English paper
and Math test. Determine whether each graph has a larger or smaller standard deviation.
40+
35
30-
25
20
15-
Select an answer
10-
60
70
80
90
Math Score
40-
30-
20-
Select an answer
10-
70
on
Expert Solution
This question has been solved!
Explore an expertly crafted, step-by-step solution for a thorough understanding of key concepts.

This is a popular solution!

Trending now
This is a popular solution!

Step by step
Solved in 2 steps with 1 images

Recommended textbooks for you
Big Ideas Math A Bridge To Success Algebra 1: Stu…
Algebra
ISBN:
9781680331141
Author:
HOUGHTON MIFFLIN HARCOURT
Publisher:
Houghton Mifflin Harcourt

Glencoe Algebra 1, Student Edition, 9780079039897…
Algebra
ISBN:
9780079039897
Author:
Carter
Publisher:
McGraw Hill

Algebra: Structure And Method, Book 1
Algebra
ISBN:
9780395977224
Author:
Richard G. Brown, Mary P. Dolciani, Robert H. Sorgenfrey, William L. Cole
Publisher:
McDougal Littell
Big Ideas Math A Bridge To Success Algebra 1: Stu…
Algebra
ISBN:
9781680331141
Author:
HOUGHTON MIFFLIN HARCOURT
Publisher:
Houghton Mifflin Harcourt
Glencoe Algebra 1, Student Edition, 9780079039897…
Algebra
ISBN:
9780079039897
Author:
Carter
Publisher:
McGraw Hill
Algebra: Structure And Method, Book 1
Algebra
ISBN:
9780395977224
Author:
Richard G. Brown, Mary P. Dolciani, Robert H. Sorgenfrey, William L. Cole
Publisher:
McDougal Littell