The below figures show possible cases in the market for pizza. Which figure shows the effect of a decrease in the price of a hamburger, which for consumers is a substitute for pizza? A) Figure A D) Figures B and C C) Figure D B) Figure B
The below figures show possible cases in the market for pizza. Which figure shows the effect of a decrease in the price of a hamburger, which for consumers is a substitute for pizza? A) Figure A D) Figures B and C C) Figure D B) Figure B

Microeconomics A Contemporary Intro
10th Edition
ISBN:9781285635101
Author:MCEACHERN
Publisher:MCEACHERN
Chapter18: Income Distribution And Poverty
Section: Chapter Questions
Problem 4QFR

Related questions

Question
The below figures show possible cases in the market for pizza. Which figure shows the effect of a decrease in the price of a hamburger, which for consumers is a substitute for pizza?
A) Figure A
D) Figures B and C
C) Figure D
B) Figure B
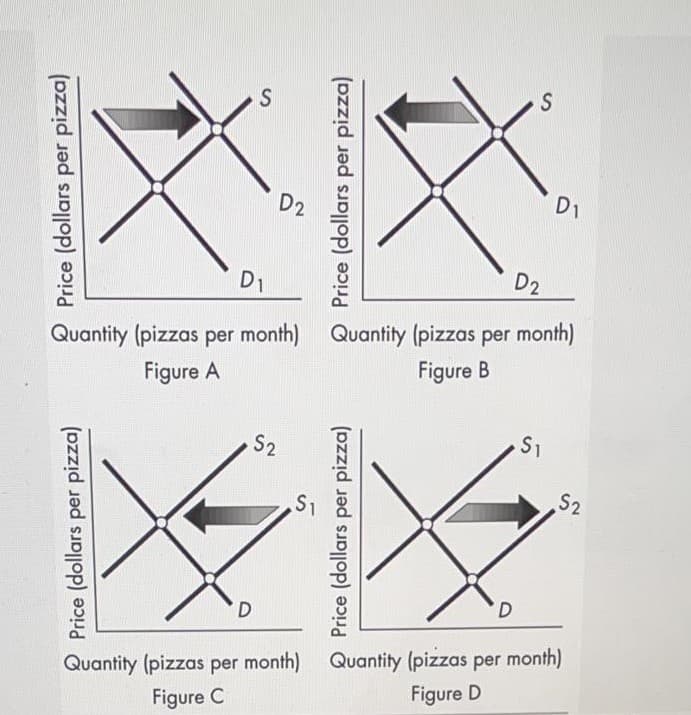
Transcribed Image Text:S
D1
D2
D2
D1
Quantity (pizzas per month) Quantity (pizzas per month)
Figure B
Figure A
S1
S2
S2
Quantity (pizzas per month) Quantity (pizzas per month)
Figure D
Figure C
Price (dollars per pizza)
Price (dollars per pizza)
Price (dollars per pizza)
Price (dollars per pizza)
Expert Solution
This question has been solved!
Explore an expertly crafted, step-by-step solution for a thorough understanding of key concepts.

Step by step
Solved in 2 steps

Knowledge Booster


Learn more about
Need a deep-dive on the concept behind this application? Look no further. Learn more about this topic, economics and related others by exploring similar questions and additional content below.Recommended textbooks for you