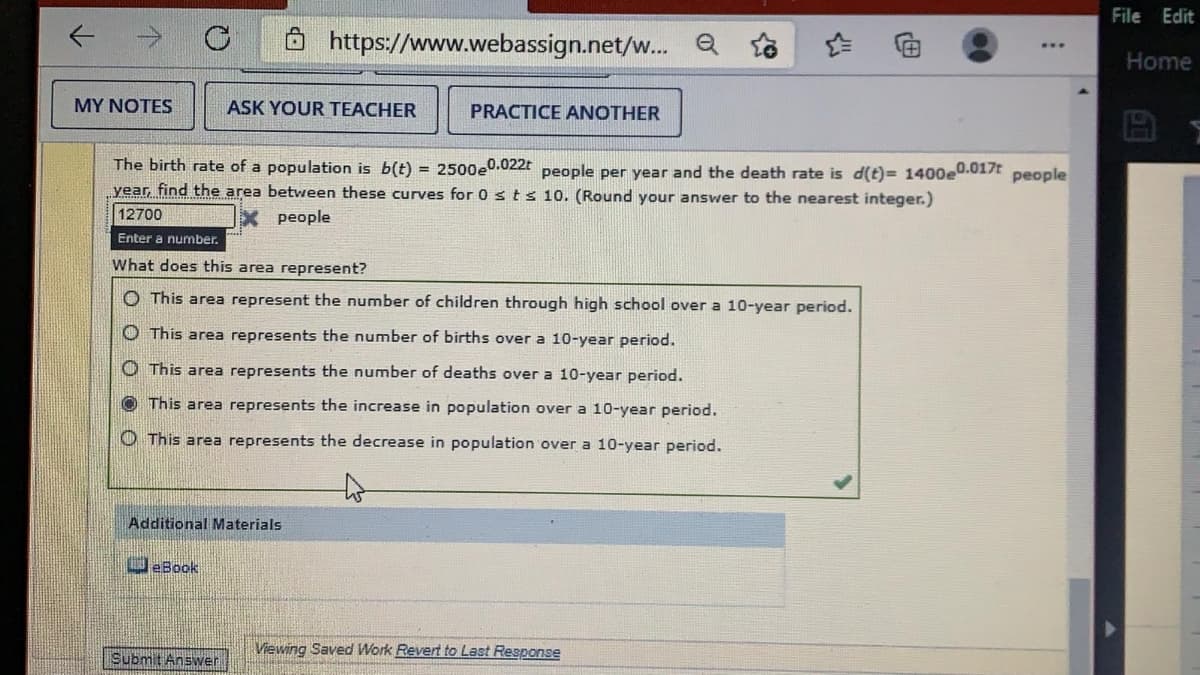
The birth rate of a population is b(t) = 2500e0.022r people per year and the death rate is d(t)= 1400e0.017E year, find the area between these curves for 0 sts 10. (Round your answer to the nearest integer.) 12700 peoples X people Enter a number. What does this area represent? O This area represent the number of children through high school over a 10-year period. O This area represents the number of births over a 10-year period. O This area represents the number of deaths over a 10-year period. O This area represents the increase in population over a 10-year period. O This area represents the decrease in population over a 10-year period.


Optimization
Optimization comes from the same root as "optimal". "Optimal" means the highest. When you do the optimization process, that is when you are "making it best" to maximize everything and to achieve optimal results, a set of parameters is the base for the selection of the best element for a given system.
Integration
Integration means to sum the things. In mathematics, it is the branch of Calculus which is used to find the area under the curve. The operation subtraction is the inverse of addition, division is the inverse of multiplication. In the same way, integration and differentiation are inverse operators. Differential equations give a relation between a function and its derivative.
Application of Integration
In mathematics, the process of integration is used to compute complex area related problems. With the application of integration, solving area related problems, whether they are a curve, or a curve between lines, can be done easily.
Volume
In mathematics, we describe the term volume as a quantity that can express the total space that an object occupies at any point in time. Usually, volumes can only be calculated for 3-dimensional objects. By 3-dimensional or 3D objects, we mean objects that have length, breadth, and height (or depth).
Area
Area refers to the amount of space a figure encloses and the number of square units that cover a shape. It is two-dimensional and is measured in square units.


Trending now
This is a popular solution!

Step by step
Solved in 2 steps with 3 images


