The bottom panel of figure 1 (p. 311) shows the probability histogram for the total number of spots when a pair of dice are rolled. (a) The chance that the total number of spots will be between 7 and 10 (inclusive) equals the area under the histogram between ___and ___ (b) The chance that the total number of spots will be 7 equals the area under the histogram between
The bottom panel of figure 1 (p. 311) shows the probability histogram for the total number of spots when a pair of dice are rolled. (a) The chance that the total number of spots will be between 7 and 10 (inclusive) equals the area under the histogram between ___and ___ (b) The chance that the total number of spots will be 7 equals the area under the histogram between

Algebra & Trigonometry with Analytic Geometry
13th Edition
ISBN:9781133382119
Author:Swokowski
Publisher:Swokowski
Chapter10: Sequences, Series, And Probability
Section10.8: Probability
Problem 35E

Related questions
Question
100%
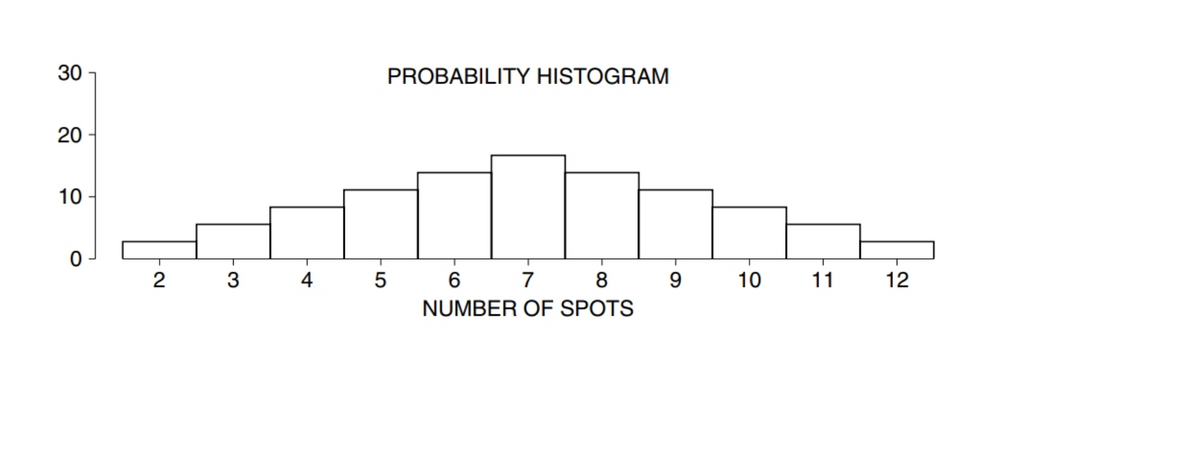
The bottom panel of figure 1 (p. 311) shows the probability histogram for the total number of spots when a pair of dice are rolled. (a) The chance that the total number of spots will be between 7 and 10 (inclusive) equals the area under the histogram between ___and ___ (b) The chance that the total number of spots will be 7 equals the area under the histogram between ___ and ____
Transcribed Image Text:30 -
PROBABILITY HISTOGRAM
20-
10 -
4
6.
7
8
9.
10
11
12
NUMBER OF SPOTS
LO
2.
Expert Solution
This question has been solved!
Explore an expertly crafted, step-by-step solution for a thorough understanding of key concepts.

This is a popular solution!

Trending now
This is a popular solution!

Step by step
Solved in 2 steps with 1 images

Recommended textbooks for you
Algebra & Trigonometry with Analytic Geometry
Algebra
ISBN:
9781133382119
Author:
Swokowski
Publisher:
Cengage


College Algebra
Algebra
ISBN:
9781305115545
Author:
James Stewart, Lothar Redlin, Saleem Watson
Publisher:
Cengage Learning
Algebra & Trigonometry with Analytic Geometry
Algebra
ISBN:
9781133382119
Author:
Swokowski
Publisher:
Cengage
College Algebra
Algebra
ISBN:
9781305115545
Author:
James Stewart, Lothar Redlin, Saleem Watson
Publisher:
Cengage Learning