

Q: Make a Box plot for each data interpret your answer. B. Data B: 33,22, 23, 29, 40, 43, 47, 49
A: Given data: 33,22, 23, 29, 40, 43, 47, 49
Q: of the data, explain why. 40 35 44 40 44 46 44 40 46 47 46 44 44 39 ind the mean cost. Select the…
A: Given 40,35,44,40,44,46,44,40,46,47,46,44,44,39
Q: Create a set of data that is represented by the box plot below.
A: The above box-plot is drawn such that the first quartile and the Median values are equal
Q: Make a Box plot for each data interpreter answer. A. Data a: 2,3,6,4,6,7,8,10
A: Given data: 2,3,6,4,6,7,8,10
Q: The box-and-whisker plot below shows the heights, in inches, of the students in a 7th grade class.…
A: Solution is given below:
Q: The stem-and-leaf plot of weights (in pounds) of carry-on luggage on a plane is shown below. Find…
A:
Q: rependent Practice Use a graphing calculator to construct a histogram and a box-and-whisker plot for…
A: 42,48,51,39,47,50,48,51,54,46,49,36,50,55,51,43,46,37,50,52,43,40,33,51,45,53,44,40,52,54,48,51,47,4…
Q: (a) Find the five-number summary, and (b) draw a box-and-whisker plot of the data. 37 8 4 2 9 8 6 9…
A:
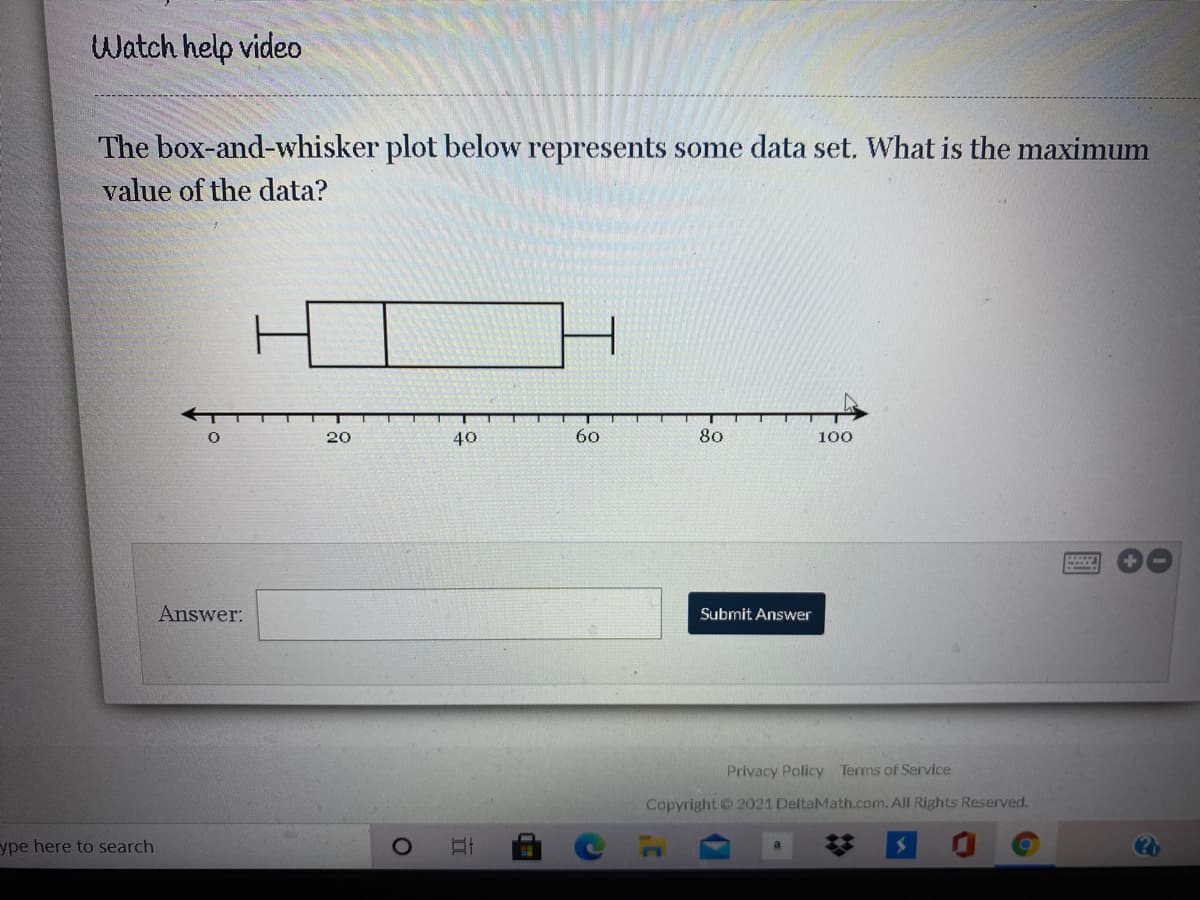
Q: The box-and-whisker plot below represents some data set. What is the maximum value of the data? O 10…
A:
Q: According to the box plot, what is the typical number of days it takes a tomato plant to produce…
A: The 5 number summary can be directly seen from this unlabeled box plot. Median≃72…
Q: 7. The line plot below shows the number of red items of clothing owned by each student in a class. X…
A: To find: The median of the given data. Calculation: Create a frequency distribution table. Class…
Q: TEST SCORES 40 50 60 70 80 90 100
A: Given box plot is
Q: Provide an appropriate response. The numbers of home runs that Barry Bonds hit in the first 18 years…
A: The data set in the ascending order is, 16, 19, 24, 25, 25, 33, 33, 34, 34, 37, 37, 40, 42, 45, 46,…
Q: Use the stem-and-leaf plot to list the actual data entries. What is the maximum data entry? What is…
A: From the given information, the data values are 27, 34, 41, 42, 42, 45, 47, 47, 48, 50, 51, 51, 52,…
Q: pediatrician wants to determine the relation that may exist between a child's height and head…
A:
Q: The dot plot of time (in minutes) it takes employees to drive to work is shown below. Find the mean,…
A: Given data The dot plot of time taken by employees to drive to work is given.
Q: the
A:
Q: Consider the data set below. Construct a stem-and-leaf plot for this data. 7, 8, 13, 19, 23, 25, 25,…
A:
Q: Brand A, Brand B, and Brand C sold a number of items each month in 2019. Each brand described their…
A: Given graph is :
Q: Witch statement best describes the data set represented by this box and whisker plot
A:
Q: Use the dot plot to list the actual data entries. What is the maximum data entry? What is the…
A: Based on the given dot plot the actual data entries are 22,22,23,23,23,24,24,24,24,24,25,26,26,27,28…
Q: 3. The height of basketball players is considered what kind of data? * A. Nominal B. Ordinal C.…
A: Answer - The height of basketball players is considered what kind of data?
Q: The box-and-whisker plot below represents some data set. What is the range of the data? 20 40 60 80…
A: In this question we have to find the range of the data.
Q: Make a box plot for each data. Interpret your answer. 3. Data C. 21,31,26,28,30,28,45,32
A: First arrange the data in ascending order: C=21,26,28,30,31,32,45 As seen from the data, it contains…
Q: tch help video The box-and-whisker plot below represents some data set. What is the range of the…
A: Range need to be calculated
Q: Watch help vide0 The box-and-whisker plot below represents some data set. What is the range of the…
A: Range = Maximum value - Minimum value
Q: The stem-and-leaf plot below shows test scores for 25 students. Test Scores Stem Leaf 357 6. 2 4 6…
A: From given stem and leaf plot the data values…
Q: Make a box plot for each data. Interpret your answer. 1. Data A: 2, 3, 6, 4, 6, 7, 8, 10
A: 1. Step-by-step procedure to draw Box plot using Excel: In Excel sheet, enter and select Data A in…
Q: (b) Find the 30th percentile. Also, find the percentile rank of 28. (c) Draw a box-and-whisker plot.
A:
Q: The data below represent the infant mortality rates and the life expectancies for seven selected…
A: Given information: Infant Mortality Life Expectancy 63 45 199 31 71 51 61 47 67 39 35…
Q: A scatter plot puts the independent data along the horizontal axis. O True O False
A: Solution
Q: The number of home runs that Mark McGwire hit in the first 13 years of his major league baseball…
A: Type your answer in rows and columns using the symbol "\ or |" as the separator between stem and…
Q: Watch help video The box-and-whisker plot below represents some data set. What is the value of the…
A: We have to find
Q: The box-and-whisker plot below represents some data set. What percentage of the data values are…
A:
Q: The box-and-whisker plot below represents the number of guests at a local restaurant per day…
A: From given information
Q: Make a box-and-whisker plot. Label the minimum, maximum, first quartile, median, and third quartile.…
A: Given:- Daily Attendance: 29,24,28,32,30,31,26,33 To Find That:- Make a box and whisker plot. Label…
Q: a. What should be the label on the horizontal axis of the scatter plot? b. What should be the label…
A: Given: A scatter plot for blocks and blocks per game in the given volleyball tournament. (a)…
Q: The box-and-whisker plot below represents some data set. What percentage of the data values are…
A: Range of given box and whisker plot = Highest data point - lowest data point= 96 - 16 = 80Range of…
Q: The box-and-whisker plot below represents some data set. What percentage of the data values are…
A:
Q: A pet store surveys 20 people who enter the store to ask how many pets each shopper has. The results…
A: Histogram is a graphical representation of continuous frequency data.According to the provided…
Q: 29. The data represent the weights (in pounds) of dogs at a dog show. 8, 30, 37, 42, 50, 45, 35, 32,…
A: Given- The data represent the weight of Dog in pounds. To do- Find Mean , Median and Mode
Q: Use the scatter plot to answer the following questions. Pizza Prices Around Town ở 1 2 34 5 67 89 10…
A: Given: Scatter plot
Q: [CLO-1] Find the median of the data set (1,2,3,6,11} 03 O 4.5 0 6 0 2
A:
Q: Baseball pitchers on a major league team throw at the following speeds, measured in miles per hour:…
A: Given data, Speed 72 84 89 93 100 90 88 80 84 87
Q: What is the difference in the IQRS? The double box plot shows the number of car shows attended by…
A: Use the formula for interquartile range IQR=Q3-Q1
Q: The variation of data in a data set is determined by O a. Variance of the data O b. Percentile…
A: Task: to measure variation of the data:
Q: The box-and-whisker plot below shows the distribution of the numbers of calories per serving for a…
A:
Q: 73 59 78 40 55 43 46 55 67 56 45 54 63 57 54 57 58 48 61 49 57 59 55 65 63 46 74 42 55 53 ou are…
A: See the handwritten solution
Q: Use the scatter plot to answer the following questions: 1. What type of association does the scatter…
A: As per our guidelines, we are allowed to answer first three sub-parts only. Thanks 1. What type of…


Trending now
This is a popular solution!

Step by step
Solved in 2 steps with 1 images


- Most vertebrate adult body sizes remain constant or increase throughout their lives. Marine iguanas are different in that they can actually decrease in size, in periods of low food availability. Examine the data set here, and test the hypothesis that on average across time, iguana length changed (increased) by 1 mm. Paste your R code in the answer box, and tell me your conclusion. Data is here: https://github.com/lisamanne/biostats_data/raw/main/Iguana_lengths.csv DATA- Tributary,Species_upstream,Species_downstream I��,14,19 Juta�,11,18 Japur�,8,8 Coari,5,7 Purus,10,16 Manacapuru,5,6 Negro,23,24 Madeira,29,30 Trombetas,19,16 Tapaj�s,16,20 Xingu,25,21 Tocantins,10,12Several states have argued that the 65-mph speed limit has no justification and have refused to enforce it. The federal Department of Transportation (DOT) believes that the 65-mph limit saves lives. To illustrate its contention, the department regressed the number of traffic fatalities (Y) last year in a state on the state’s population (X1), the number of days of snow cover (X2), and the average speed of all cars (X3). The results are shown below. Table 10: Model Summary Model R R Square Adjusted R Square Std. Error of the Estimate 1 .821 a .780 .613 3.258 a. Predictors: (Constant), population, days of snow, average speed Table 11: Coefficients Coefficientsa Model Unstandardized Coefficients Standardized Coefficients t Sig. B Std. Error Beta 1 (Constant) 1.4 2.957 .473 .584 Population .00029 .00003 .0034 9.667 .000 Days of Snow 2.4 .62 .759 3.871 .000 Average Speed 10.3 1.1…Which one of the following terms depicts an S shape in a trend analysis? Group of answer choices Cubic quartic Linear Quadratic
- [item#D8] (refer to the photo below) Are predator-prey relationships density-dependent or density-independent limiting factors? Explain.An aerobic exercise instructor remembers the data given in the following table, which shows the recommended maximum exercise heart rates for individuals of the given ages. Predict the maximum exercise heart rate of a person who is 72 years old Age (x years) 20 30 40 50 60 Maximum heart rate (y beats per minute) 170 168 153 147 136Data was collected for 300 fish from the North Atlantic. The length of the fish (in mm) is summarized in the GFDT below. Lengths (mm) Frequency 200 - 202 1 203 - 205 16 206 - 208 71 209 - 211 108 212 - 214 83 215 - 217 18 218 - 220 3 What is the lower class boundary for the first class?class boundary =
- find out the squre roof for given data 1-369 2-525 3-16 4-1225Constructively interpret the given box plot belowData was collected for 300 fish from the North Atlantic. The length of the fish (in mm) is summarized in the GFDT below. Lengths (mm) Frequency 160 - 174 1 175 - 189 16 190 - 204 71 205 - 219 108 220 - 234 83 235 - 249 18 250 - 264 3 What is the class midpoint for the second class?class midpoint =
- (The horizontal green line on the graph marks the minimum desired response level. The horizontal red line on the graph marks the maximum safe response level.) (a) Which drug requires the largest dose for the desired response? ________________ ( A, B, or C?) The smallest dose? ________________ (A, B, or C?) (b) Which drug has the largest maximum response? ____________________ (A, B, or C?) The smallest? ______________ ( A, B, or C?) (c) Assuming that drugs with broader ranges of safe and reliable dosages are safer to administer, which of these drugs is the safest to administer? _______________________ (A, B, or C?)Consider the following Box plot so our data set a and data set B. Which data set has the largest value?Determine whether the following examples are discrete or continuous data sets. Write "DISCRETE" for discrete and "CONTINUOUS" for continuous. (without quotations - use for instance copy and paste to avoid typos) (a) The length of time needed for a student to complete a homework assignment.answer: (b) The distance traveled by a city bus each day.answer: (c) The number of customers waiting in line at the grocery store.answer: (d) The number of errors found on a student's research paper.answer: