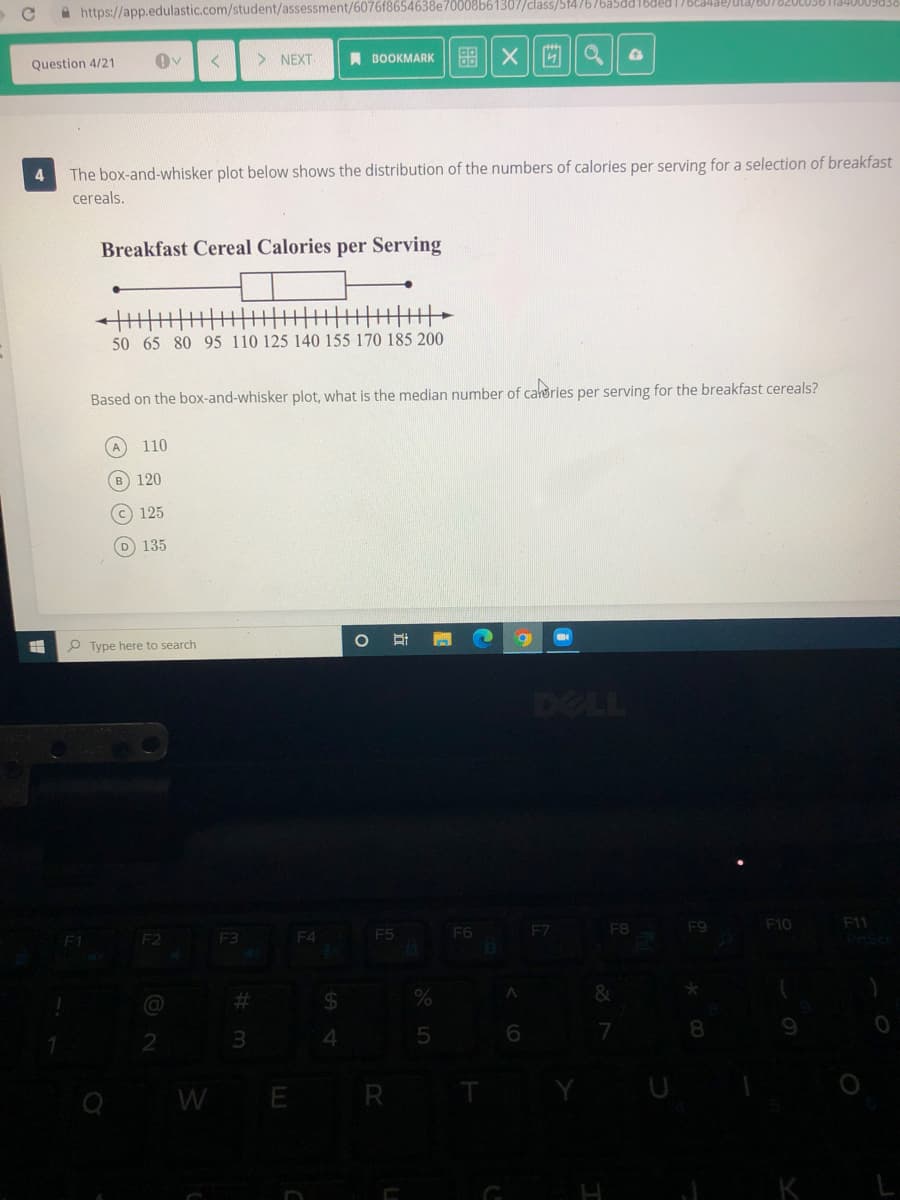
The box-and-whisker plot below shows the distribution of the numbers of calories per serving for a selection of breakfast cereals. Breakfast Cereal Calories per Serving 主丰 50 65 80 95 110 125 140 155 170 185 200 Based on the box-and-whisker plot, what is the median number of caories per serving for the breakfast cereals? A. 110 B 120 125 D 135


Q: The data represents the heights of eruptions by a geyser. Height of eruption (in.) 50 900 40 70 50…
A: Stem leaf plot which splits the data into stem and leaf. Where stem is the first value anfd leaf is…
Q: Here are the gold medal times for the women’s 100-meter freestyle (swimming) in every other Summer…
A:
Q: A student washes her clothes at a laundromat once a week. The data below give the time (in minutes)…
A: Solution-: Given data:75,62,84,73,107,81,93,72,135,77,85,67,90,83,112 Our aim to (a) Prepare a…
Q: From the scatter plot, which of the following is FALSE? Pulse After Marching O b. 110 100 70 60 40…
A:
Q: The box-and-whisker plot below shows the heights, in inches, of the students in a 7th grade class.…
A: Solution is given below:
Q: Construct the stem-and-leaf plot. Choose the correct answer below. TETE DE DE O A. O B. O C. Stem…
A: The provided data are in increasing order: 67,72,75,86,88,89,89,90,98,100 Construct the…
Q: Students in an experimental psychology class did research on depression as a sign of stress. A test…
A: Given n=30
Q: his box-and-whisker plot displays information about the test scores for 25 students. Test Scores +++…
A: The box and whisker plot displays information about the test scores for 25 students.
Q: Construct a box plot for the given data. Include values of the 5-number summary in all box plots.…
A: Given data is,32 , 37, 41, 44, 46, 48, 53, 5557, 57, 59, 63, 65, 66, 68, 6970, 71, 74, 74, 75, 77,…
Q: Here is a data set: 60 56 54 73 61 67 87 87 56 68 69 67 65 60 78 60 65 79 73 51 85 68 55 51 60 66 52…
A:
Q: Here is a data set: 36 21 59 36 36 38 39 26 33 45 34 26 41 38 35 25 24 24 32 33 45 58 29 44 30 34 31…
A: We have to find given blank..
Q: The following data represent the number of grams of fat in breakfast meals offered at a local fast…
A: a. Stem-and-leaf plot: A graphical representation of the quantitative data in which each data entry…
Q: The following data represent the number of grams of fat in breakfast meals offere plot and (b)…
A: Solution a. Stem-and-leaf plot: A graphical representation of the quantitative data in which each…
Q: Here is a data set: 20 22 22 39 37 43 33 38 39 45 31 27 26 30 53 32 20 36 56 32 30 38 29 55 37 43 41…
A: Data given 20,22,22,39,37 43,33,38,39,45 31,27,26,30,53 32,20,36,56,32 30,38,29,55,37 43,41,43,21,32…
Q: According to the box-and-whisker plot, what was the median weight of Frank's classmates? Weights of…
A: If n is odd, median=n+12th term
Q: 2. A school keeps a record of drinks purchased from their cafeteria. The data in the table show the…
A: Due to Bartleby guidelines, only 1question can be solved. Please repost the remaining questions to…
Q: Tim took a random survey of 20 sixth graders and 20 eighth graders. He asked how many hours a week…
A: Dot plot is used to represent the observations and its frequency graphically. The observations are…
Q: Students in an experimental psychology class did research on depression as a sign of stress. A test…
A: Students in an experimental psychology class did research on depression as a sign of stress. A test…
Q: Here is a data set: 63 55 69 64 86 52 57 58 69 81 63 61 59 || 64 69 66| 66 | 59 || 60 || 75 59 67 60…
A: To complete the given stem-and-leaf-plot As shown below;
Q: The stem-and-leaf plot below shows test scores for 25 students. Test Scores Stem Leaf 357 6. 2 4 6…
A: From given stem and leaf plot the data values…
Q: The following data represent the number of grams of fat in breakfast meals offered at a local fast…
A: For a stem and leaf plot with two digit integer we write the first digit in the stem part and and…
Q: The scatter plot shows the heights and weights of players on the basketball team. If a player 70…
A: The given scatter plot was perfectly visible
Q: The following data represent the number of grams of fat in breakfast meals offered at a local fast…
A: (a) Obtain the stem and leaf plot for the given data. The stem and leaf plot is constructed…
Q: The box plots show the target heart rates of men 20-40 years old and men 50-70 years old. Target…
A: The Statement A is false
Q: A researcher studying mouse behaviour recorded the time (in seconds) it took 15 different mice to…
A: In every statistical analysis, before moving to any inferential statistics we do descriptive…
Q: The following data represent the number of grams of fat in breakfast meals offered at a local fast…
A: we need to construct stem-leaf plot
Q: Interpret whether the data is normally distributed. 57997 57113 54123 63936 64835 6680…
A: Required: To test whether the given data is normally distributed
Q: Waldo and Freddy caught fish one weekend. The dot plots show the lengths of the fish they caught.…
A: Which statement about the lengths of the fish caught by Waldo and Freddy appears tobe true?A The…
Q: Here is a data set: 40 61 44 51 53 79 50 52 50 52 74 61 46 51 54 50 51 40 78 52 61 42 56 52 44 65 42…
A: Stem and leaf plot: The stem plot and histogram will display the similar pattern of graph. Addition…
Q: The following data represent the number of grams of fat in breakfast meals offered at a local fast…
A: The given data set shows the number of grams of fat in breakfast meals offered at a local fast food…
Q: 6. A local hospital kept track one day of the blood type of their male and female patients. The…
A: 6) Given that : Frequency distribution is given. We use relative frequency formula R = fi /…
Q: A В +++ 40 50 60 70 80 90 100
A: Given data is
Q: 2. A school keeps a record of drinks purchased from their cafeteria. The data in the table show the…
A: Since you have asked multiple questions, so we will solve the first question for you. If you want…
Q: The table shows the mathematics entrance test scores x and the final examination scores y in an…
A:
Q: 10. The BOx and WhIsker plotS compare the weekly salaries, in dollars, of a sample of 25-year-old…
A: From the Boxplot we can find the Five number summary table. It includes, Minimum, First quartile,…
Q: Examine the data displayed by the box-and-whisker plot. Determine whether the distribution is…
A: Given: From the figure shown above the distribution is skewed to the right. Median from the…
Q: The data represents the heights of eruptions by a geyser. Height of eruption (in.) 60 36 50 90- Use…
A:
Q: 5. The scatter plot below suggests a linear relationship between time spent studying and the grade…
A: We will solve the following.
Q: The data to the right shows the number of graduating students with business majors at a university…
A: Given data : 277,247,224,197,269,241,214,187,263,236,208,182,256,230,202
Q: The accompanying table shows a portion of the average SAT math score (Math), the average SAT writing…
A: a1) Option 2 is correct : Math scores and writing scores have a positive linear relationship By…
Q: The scatter plot shows a set of data for the variables x and y. 200 180 160 140 120 100 80 60 40 20…
A: Observing the graph properly we have
Q: Hello! I need help with this particular question on my study guide. There is an attachment below.…
A: The box plot contains 5-number summary. That is, the minimum value, the first quartile, the second…
Q: 2. A school keeps a record of drinks purchased from their cafeteria. The data in the table show the…
A:
Q: The box-and-whisker plot shows the number of residents who purchased solar panels during the first…
A: Now , we will find the solution using the given data.
Q: The dot plots show the number of hours two students watched television in the month of June. .. 15…
A: Median is one of the statistical measures of central tendency. When we have a sorted dataset, then…
Q: 5. The scatter plot below suggests a linear relationship between time spent studying and the grade…
A: From the graph the line intercepts y-axis At 50%
Q: The box-and-whisker plot below shows the ages of bus passengers. An advertising executive says that…
A: We hav to find answe
Q: The dot plots below show the weights of the players of two teams: Team E 120 121 122 123 124 125 126…
A: The given dot plots show the weights of the players of two teams E and F
Q: Students in an experimental psychology class did research on depression as a sign of stress. A test…
A: Given data:…
Q: Calculate the coefficient of variation of a distribution with: 2*f = 110 and *² ·f = 1235 n = 10,…
A:


Trending now
This is a popular solution!

Step by step
Solved in 2 steps with 2 images


- he Princeton Review, a company that tracks information about various colleges, reports that 30% of CofC students are out-of-state students. If we took many samples of CofC students, and for each sample calculate the proportion $\hat{p}$ of out-of-state students in that sample, what would be the center of this distribution?The over 40 years age distribution of two oldest assemblies in XYZ District were given to you on arrival at your first station. The age distributions are presented below. Assembly A 82 66 70 77 94 67 73 78 82 74 90 45 62 85 57 72 94 83 85 70 95 71 89 87 75 74 Assembly B 85 89 70 76 49 66 71 71 75 82 73 77 68 79 55 91 52 63 64 84 81 65 73 67 66 72 i) Construct a single stem and leaf plot with Assembly A on the right and Assembly B on the left. Comment on the distribution Solve the equations: i) ii) 9 (3X+4)-2X=11+5(4X-1) iii)The manager of a fleet of automobiles is testing two brands of radial tires. He assigns one tire of each brand at random to the two rear wheels of eight cars and runs the cars until the tires wear out. The data (in kilometers) are shown below: Car Brand 1 Brand 2 1 34900 36700 2 45500 47200 3 37100 37700 4 32000 31400 5 48900 47800 6 32800 36900 7 38500 38900 8 30100 31800 Find a 95% confidence interval on the difference in mean mileage. Assume that the differences of the distances are approximately normally distributed.
- The accounting department of Plank Inc. has been asked to estimate the average salaries of its senior executives worldwide in order to calculate a productivity bonus increase. For this, a random sample of 5 of its executives was taken, according to these data determine the point estimate of the mean of its executives' salaries.Salaries in thousands of US$ are: 2,298; 2,470; 2,407; 2,548; 2,099Select one:a. x ̅ =2,364.4b. x ̅ =2.365c. x ̅ =3,640.4d. x ̅ =23.700e. x ̅ =29.554,5The distribution of the variable Local Tuition is skewed to the: Select one: a. Right b. Left Business School Full-Time Enrollment Students per Faculty Local Tuition ($) Foreign Tuitiion ($) English Test Work Experience Starting Salary ($) 1 Melbourne Business School 200 5 24,420 29,600 No Yes 71,400 2 University of New South Wales (Sydney) 228 4 19,993 32,582 No Yes 65,200 3 Indian Institute of Management (Ahmedabad) 392 5 4,300 4,300 No No 7,100 4 Chinese University of Hong Kong 90 5 11,140 11,140 No No 31,000 5 International University of Japan (Niigata) 126 4 33,060 33,060 Yes No 87,000 6 Asian Institute of Management (Manila) 389 5 7,562 9,000 No Yes 22,800 7 Indian Institute of Management (Bangalore) 380 5 3,935 16,000 No No 7,500 8 National University of Singapore 147 6 6,146 7,170 Yes Yes 43,300 9 Indian Institute of Management (Calcutta) 463 8 2,880 16,000 No No 7,400 10 Australian National University (Canberra) 42 2 20,300 20,300 Yes…A car insurance broker for high risk drivers compares the total number of demerit points on the license of each driver and their monthly car insurance premium. The data is recorded for sample of 20 different high risk drivers. Demerit points. 7 7 11 5 10 11 13 10 9 17 8 10 4 19 6 8 5 4 8 17 Monthly Insurance Premium 157 205 346 194 309 596 687 406 236 716 244 510 118 821 275 276 276 269 276 786 Please give the excel formula and or the spreadsheet. Thank you.
- The business objective of the director of Game Ghana is to forecast monthly sales for all new stores, based on the number of profiled customers who live no more than 30 minutes from a Game store. To examine the relationship between the number of profiled customers who live within a fixed radius from a Game store and it monthly sales, data were collected from a sample of 10 stores:Store 1 2 3 4 5 6 7 8 9 10No of customers (‘000)5728432453 Monthly Sales (‘000)81261487910128(a) Use the least-squares method to compute the regression coefficients ? ??? ?(b) Write down the estimated equation and predict the monthly sales if there are 9000 customers(c) Determine the coefficient of determination, r2 and explain its meaning in this problem(d) Determine the value of the extent of relationship between monthly sales and number of customers, and interpret your results.A group of 13 health children and adolescents participated in a study designed to analyze the relationship between age (AGE in years) and average total sleep time (ATST in minutes). To obtain a measure for ATST, recordings were taken on each subject on three consecutive nights and then averaged. The results obtained are given below along with the corresponding scatter plot. Age ATST 4.4 586 14 461.75 10.1 491.1 6.7 565 11.5 462 9.6 532.1 12.4 477.6 8.9 515.2 11.1 493 7.75 528.3 5.5 575.9 8.6 532.5 7.2 530.5 Estimated regression line: y-hat = 648.483 - 14.041x Suppose that a new subject is added to the study data and that subject is 12.5 years old with an AST of 580 minutes. IF the regression model were to be refit with this additional data point, would the new slope be greater or less than -14.041? Justify your response.The National Football League (NFL) records a variety of performance data for individuals and teams. To investigate the importance of passing on the percentage of games won by a team, the following data show the conference (Conf), average number of passing yards per attempt (Yds/Att), the number of interceptions thrown per attempt (Int/Att), and the percentage of games won (Win%) for a random sample of 16 NFL teams for one full season. Team Conf Yds/Att Int/Att Win% Arizona Cardinals NFC 6.5 0.042 50.0 Atlanta Falcons NFC 7.1 0.022 62.5 Carolina Panthers NFC 7.4 0.033 37.5 Cincinnati Bengals AFC 6.2 0.026 56.3 Detroit Lions NFC 7.2 0.024 62.5 Green Bay Packers NFC 8.9 0.014 93.8 Houstan Texans AFC 7.5 0.019 62.5 Indianapolis Colts AFC 5.6 0.026 12.5 Jacksonville Jaguars AFC 4.6 0.032 31.3 Minnesota Vikings NFC 5.8 0.033 18.8 New England Patriots AFC 8.3 0.020 81.3 New Orleans Saints NFC 8.1 0.021 81.3 Oakland Raiders AFC 7.6 0.044 50.0 San Francisco 49ers…
- The manager of a company that assembles and exports a particular type of pumps wants to know if there is a link between the number of hours spent by assembly workers in training and their productivity on the job. A random sample of 7 assembly workers was selected and their performances evaluated. The summary of the obtained data is listed in Table 2. Table 2: Shows the time spend by workers during training and their productivity on jobTraining hours (x) 20 36 20 38 40 33 32Output (y) 40 70 44 56 60 48 62 (i) Construct a scatter plot of the sample data and comment on the relationship between hours of training and output. (ii) Estimate a simple regression line, using the method of least squares, to identify a linear relationship between the hours of training received by assembly workers and their output (i.e. number of units assembled per day). (iii) Interpret, in context, the gradient/slope of the regression line. (iv) Estimated the output at 20 hours training time. (v) Interpret the…The director of cooperative education at a state college wants to examine the effect of cooperative education job experience on marketability in the work place. She takes a random sample of 4 students. For these 4, she finds out how many times each had a cooperative education job and how many job offers they received upon graduation. These data are presented in the table below. Student CoopJobs JobOffer 1 1 4 2 2 6 3 1 3 4 0 1 set up a scatter plot with Coop Jobs as the horizontal axis and Job offer as the vertical axisA report gave the accompanying data for the 50 U.S. states on the percentage of the population that was born in the state and is still living there. The data values have been arranged in order from largest to smallest. 75.6 71.4 69.6 69.0 68.6 67.5 66.7 66.3 66.1 66.0 66.0 65.2 64.6 64.3 63.8 63.7 62.8 62.6 61.8 61.8 61.5 61.1 59.2 59.0 58.7 57.3 57.1 55.8 55.8 55.5 55.3 54.9 54.7 54.5 54.0 54.0 53.6 53.5 52.8 52.5 50.2 50.2 48.9 48.7 48.2 47.3 43.4 40.4 35.8 28.2 (a) Find the values of the median, the lower quartile, and the upper quartile. (Enter your answers to one decimal place.) median = lower quartile = upper quartile = (b) The two smallest values in the data set are 35.8 (Alaska) and 28.2 (Wyoming). Are these two states outliers? Alaska is an outlier, but Wyoming is not.Neither Alaska nor Wyoming are outliers. Wyoming is an outlier, but Alaska is not.Alaska and Wyoming are both outliers. (c) Construct a boxplot for this data set.