The candlestick chart shows the performance of the stock of a technology company over a 10-day period. Hollow bars indicate a closing price higher than the opening price. Shaded bars indicate a closing price lower than the opening price. Stock Price 136 134 132 130 128 126 You may use a calculator for this item. 124 122 T Tech Stock Data M + 6/14 6/15 6/16 6/17 6/18 6/21 6/22 6/23 6/24 6/25 Date Select all statements that are true. A. The highest opening price was on 6/24. B. The least difference between the opening and closing price was on 6/18. C. The closing price on 6/25 was at least $4.00 more than the opening price on 6/14. D. The greatest difference between the low price and the closing price was on 6/16. E. Compared to its opening price, the number of days the stock price closed higher was greater than the number of days the stock price closed lower.
The candlestick chart shows the performance of the stock of a technology company over a 10-day period. Hollow bars indicate a closing price higher than the opening price. Shaded bars indicate a closing price lower than the opening price. Stock Price 136 134 132 130 128 126 You may use a calculator for this item. 124 122 T Tech Stock Data M + 6/14 6/15 6/16 6/17 6/18 6/21 6/22 6/23 6/24 6/25 Date Select all statements that are true. A. The highest opening price was on 6/24. B. The least difference between the opening and closing price was on 6/18. C. The closing price on 6/25 was at least $4.00 more than the opening price on 6/14. D. The greatest difference between the low price and the closing price was on 6/16. E. Compared to its opening price, the number of days the stock price closed higher was greater than the number of days the stock price closed lower.

Glencoe Algebra 1, Student Edition, 9780079039897, 0079039898, 2018
18th Edition
ISBN:9780079039897
Author:Carter
Publisher:Carter
Chapter10: Statistics
Section10.6: Summarizing Categorical Data
Problem 22PPS

Related questions
Question
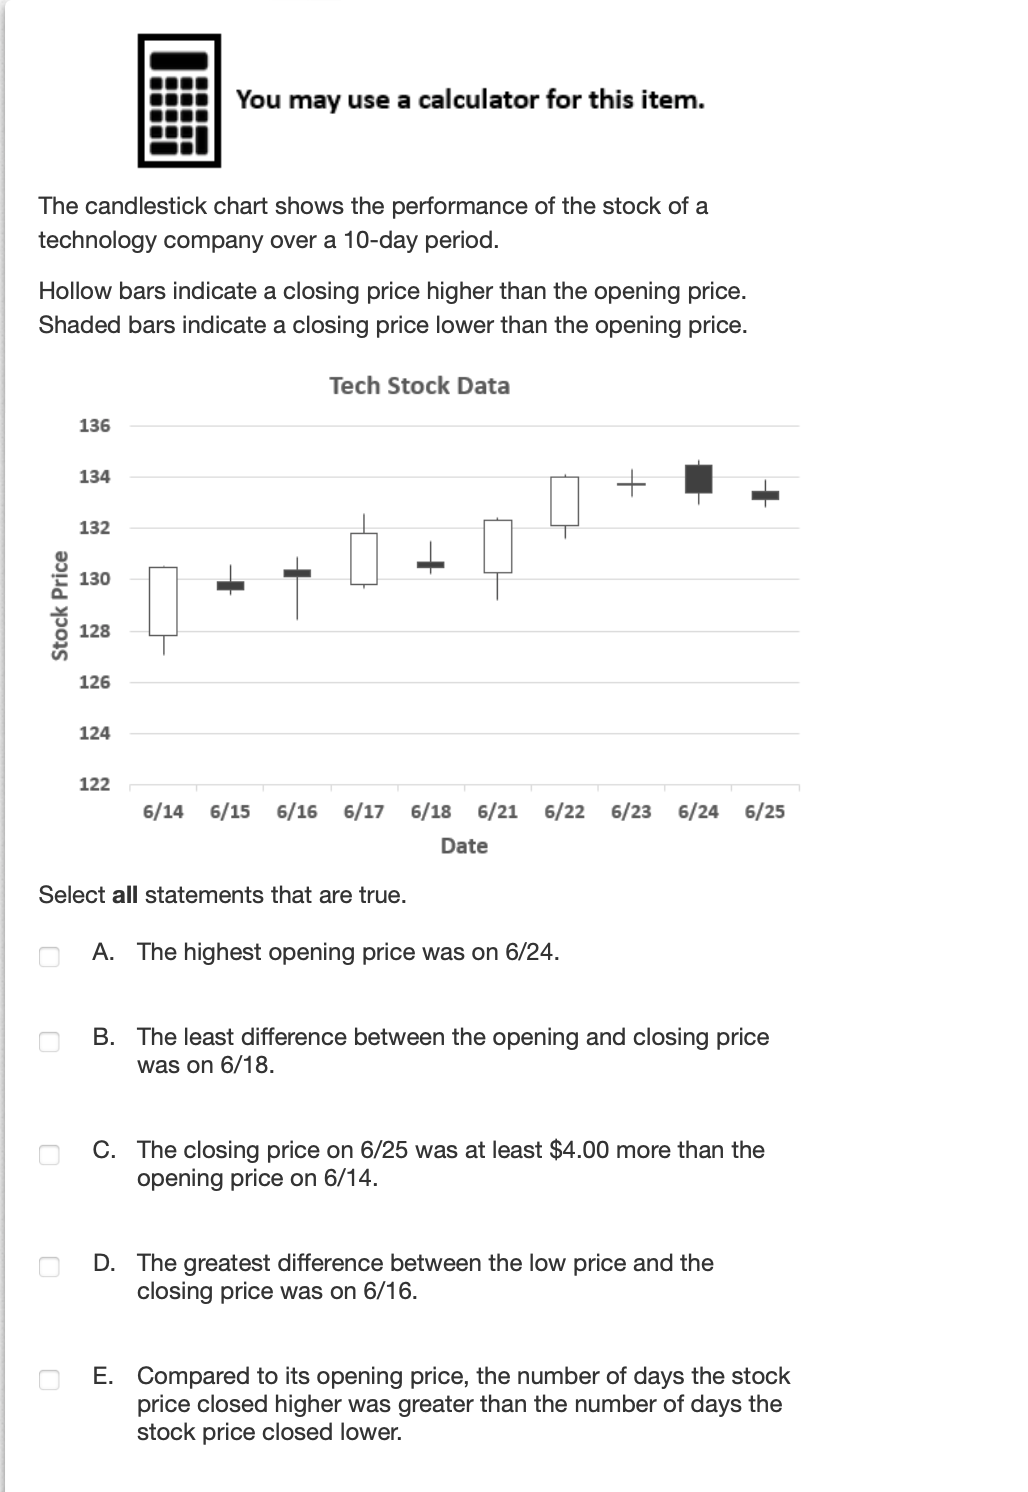
Transcribed Image Text:The candlestick chart shows the performance of the stock of a
technology company over a 10-day period.
Hollow bars indicate a closing price higher than the opening price.
Shaded bars indicate a closing price lower than the opening price.
Stock Price
136
134
132
130
128
126
You may use a calculator for this item.
124
122
Tech Stock Data
0
U
0
6/14 6/15 6/16 6/17 6/18 6/21 6/22 6/23 6/24 6/25
Date
Select all statements that are true.
A. The highest opening price was on 6/24.
B. The least difference between the opening and closing price
was on 6/18.
C. The closing price on 6/25 was at least $4.00 more than the
opening price on 6/14.
D. The greatest difference between the low price and the
closing price was on 6/16.
E. Compared to its opening price, the number of days the stock
price closed higher was greater than the number of days the
stock price closed lower.
Expert Solution
This question has been solved!
Explore an expertly crafted, step-by-step solution for a thorough understanding of key concepts.

This is a popular solution!

Trending now
This is a popular solution!

Step by step
Solved in 5 steps with 5 images

Recommended textbooks for you
Glencoe Algebra 1, Student Edition, 9780079039897…
Algebra
ISBN:
9780079039897
Author:
Carter
Publisher:
McGraw Hill

Functions and Change: A Modeling Approach to Coll…
Algebra
ISBN:
9781337111348
Author:
Bruce Crauder, Benny Evans, Alan Noell
Publisher:
Cengage Learning

Big Ideas Math A Bridge To Success Algebra 1: Stu…
Algebra
ISBN:
9781680331141
Author:
HOUGHTON MIFFLIN HARCOURT
Publisher:
Houghton Mifflin Harcourt
Glencoe Algebra 1, Student Edition, 9780079039897…
Algebra
ISBN:
9780079039897
Author:
Carter
Publisher:
McGraw Hill
Functions and Change: A Modeling Approach to Coll…
Algebra
ISBN:
9781337111348
Author:
Bruce Crauder, Benny Evans, Alan Noell
Publisher:
Cengage Learning
Big Ideas Math A Bridge To Success Algebra 1: Stu…
Algebra
ISBN:
9781680331141
Author:
HOUGHTON MIFFLIN HARCOURT
Publisher:
Houghton Mifflin Harcourt

Algebra: Structure And Method, Book 1
Algebra
ISBN:
9780395977224
Author:
Richard G. Brown, Mary P. Dolciani, Robert H. Sorgenfrey, William L. Cole
Publisher:
McDougal Littell

Holt Mcdougal Larson Pre-algebra: Student Edition…
Algebra
ISBN:
9780547587776
Author:
HOLT MCDOUGAL
Publisher:
HOLT MCDOUGAL