The characteristics of the treatment and control groups

Holt Mcdougal Larson Pre-algebra: Student Edition 2012
1st Edition
ISBN:9780547587776
Author:HOLT MCDOUGAL
Publisher:HOLT MCDOUGAL
Chapter11: Data Analysis And Probability
Section: Chapter Questions
Problem 8CR

Related questions
Question
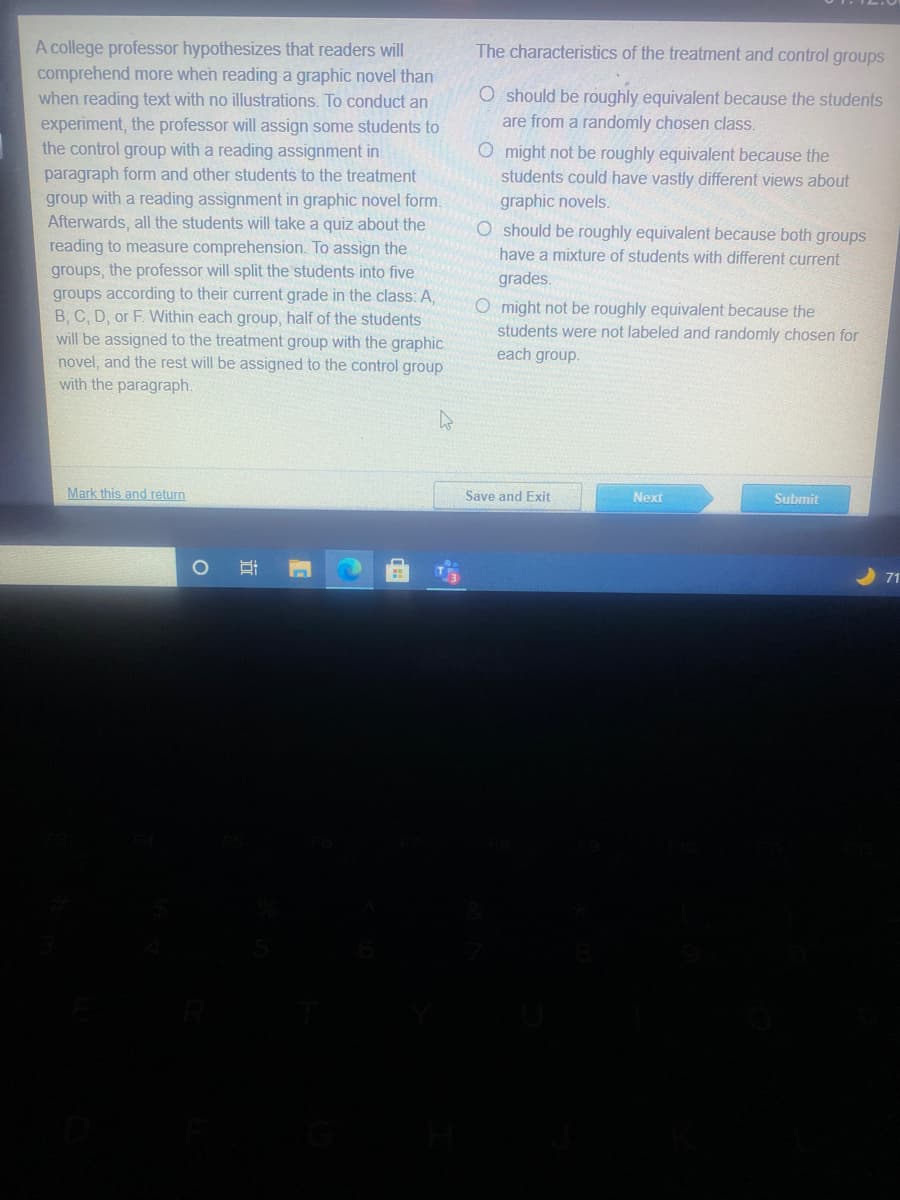
Transcribed Image Text:A college professor hypothesizes that readers will
comprehend more when reading a graphic novel than
The characteristics of the treatment and control groups
when reading text with no illustrations. To conduct an
O should be roughly equivalent because the students
are from a randomly chosen class.
experiment, the professor will assign some students to
the control group with a reading assignment in
paragraph form and other students to the treatment
group with a reading assignment in graphic novel form.
Afterwards, all the students will take a quiz about the
reading to measure comprehension. To assign the
groups, the professor will split the students into five
groups according to their current grade in the class: A,
B, C, D, or F. Within each group, half of the students
will be assigned to the treatment group with the graphic
novel, and the rest will be assigned to the control group
with the paragraph.
O might not be roughly equivalent because the
students could have vastly different views about
graphic novels.
O should be roughly equivalent because both groups
have a mixture of students with different current
grades.
O might not be roughly equivalent because the
students were not labeled and randomly chosen for
each group.
Mark this and return
Save and Exit
Next
Submit
71
近
Expert Solution
This question has been solved!
Explore an expertly crafted, step-by-step solution for a thorough understanding of key concepts.

This is a popular solution!

Trending now
This is a popular solution!

Step by step
Solved in 2 steps

Recommended textbooks for you
Holt Mcdougal Larson Pre-algebra: Student Edition…
Algebra
ISBN:
9780547587776
Author:
HOLT MCDOUGAL
Publisher:
HOLT MCDOUGAL
Holt Mcdougal Larson Pre-algebra: Student Edition…
Algebra
ISBN:
9780547587776
Author:
HOLT MCDOUGAL
Publisher:
HOLT MCDOUGAL