The coefficient of variation CV describes the standard deviation as a percent of the mean. Because it has no units, you can use the coefficient of variation to compare data with different units. Find the ca Standard deviation CV= -100% Mean Click the icon to view the data sets. CV heights -% (Round to the nearest tenth as needed.) CV weights -% (Round to the nearest tenth as needed.) What can you conclude? OA. Height is more variable than weight. B. Weight is more variable than height. Data table Heights Weights 66 181 73 200 71 76 70 74 74 75 67 69 72 67 184 202 227 222 212 195 216 178 218 186 0₁ Print Done - X
The coefficient of variation CV describes the standard deviation as a percent of the mean. Because it has no units, you can use the coefficient of variation to compare data with different units. Find the ca Standard deviation CV= -100% Mean Click the icon to view the data sets. CV heights -% (Round to the nearest tenth as needed.) CV weights -% (Round to the nearest tenth as needed.) What can you conclude? OA. Height is more variable than weight. B. Weight is more variable than height. Data table Heights Weights 66 181 73 200 71 76 70 74 74 75 67 69 72 67 184 202 227 222 212 195 216 178 218 186 0₁ Print Done - X

Big Ideas Math A Bridge To Success Algebra 1: Student Edition 2015
1st Edition
ISBN:9781680331141
Author:HOUGHTON MIFFLIN HARCOURT
Publisher:HOUGHTON MIFFLIN HARCOURT
Chapter11: Data Analysis And Displays
Section11.1: Measures Of Center And Variation
Problem 37E

Related questions
Question
100%
Transcribed Image Text:=
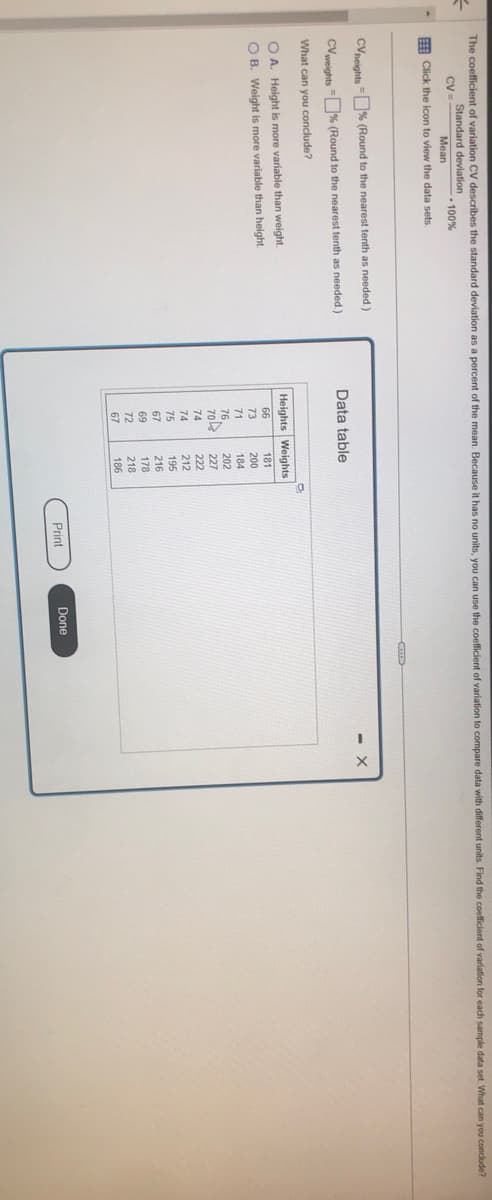
The coefficient of variation CV describes the standard deviation as a percent of the mean. Because it has no units, you can use the coefficient variation to compare data with different units. Find the coefficient of variation for each sample data set. What can you conclude?
Standard deviation
CV=
-100%
Mean
Click the icon to view the data sets.
CV heights -% (Round to the nearest tenth as needed.)
CV weights -% (Round to the nearest tenth as needed.)
What can you conclude?
OA. Height is more variable than weight.
OB. Weight is more variable than height.
Data table
Heights Weights
181
200
184
202
227
222
212
195
216
178
218
186
66
73
71
76.
70
74
74
75
67
D₂₁
72
67
Print
Done
Expert Solution
This question has been solved!
Explore an expertly crafted, step-by-step solution for a thorough understanding of key concepts.

This is a popular solution!

Trending now
This is a popular solution!

Step by step
Solved in 6 steps

Recommended textbooks for you
Big Ideas Math A Bridge To Success Algebra 1: Stu…
Algebra
ISBN:
9781680331141
Author:
HOUGHTON MIFFLIN HARCOURT
Publisher:
Houghton Mifflin Harcourt

Glencoe Algebra 1, Student Edition, 9780079039897…
Algebra
ISBN:
9780079039897
Author:
Carter
Publisher:
McGraw Hill
Big Ideas Math A Bridge To Success Algebra 1: Stu…
Algebra
ISBN:
9781680331141
Author:
HOUGHTON MIFFLIN HARCOURT
Publisher:
Houghton Mifflin Harcourt
Glencoe Algebra 1, Student Edition, 9780079039897…
Algebra
ISBN:
9780079039897
Author:
Carter
Publisher:
McGraw Hill