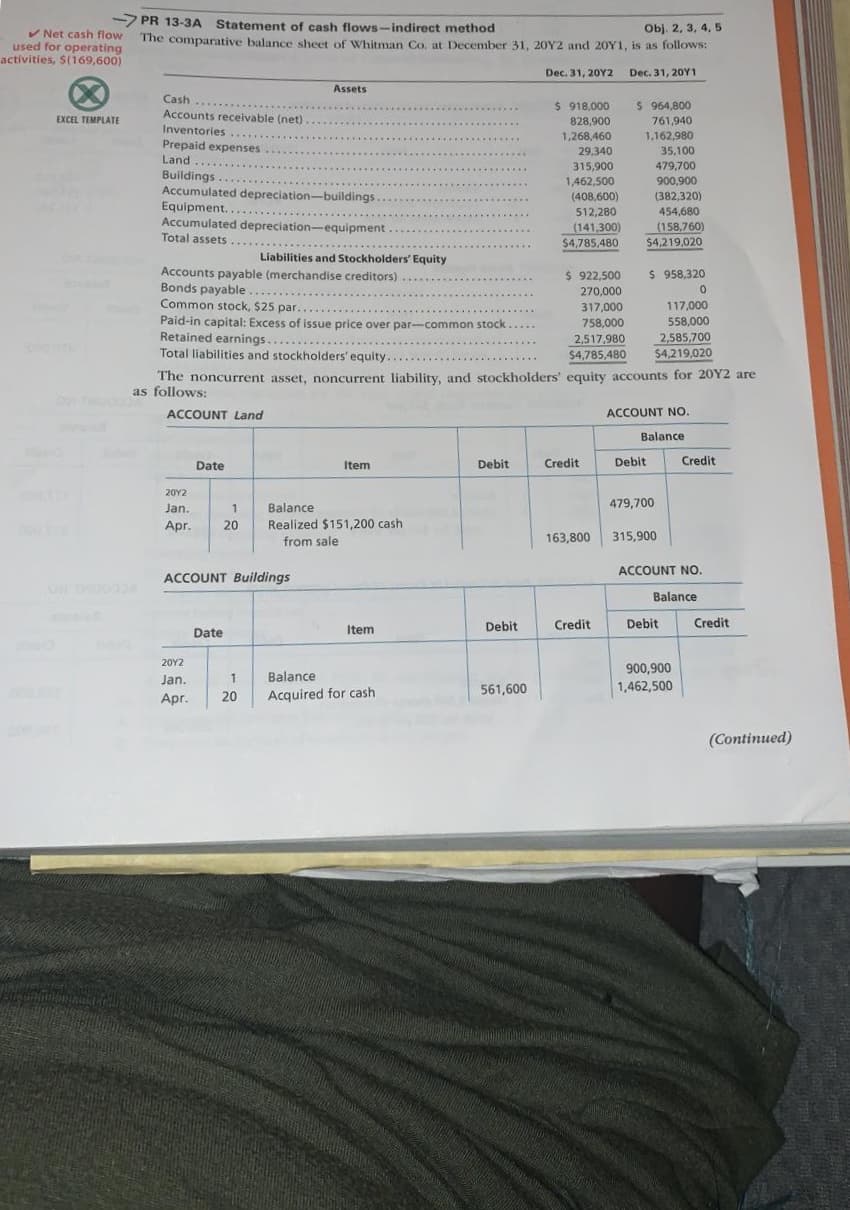
The comparative balance sheet of Whitman Co. at December 31, 20Y2 and 20Y1, is as follows:


Q: The comparative balance sheet of Hirayama Industries Inc. for December 31, 20Y2 and 20Y1, is as…
A: Cash flow statement is a statement which records inflow & outflow of cash from the three main…
Q: The comparative balance sheet of Hirayama Industries Inc. for December 31, 20Y2 and 20Y1, is as…
A: A cash flow statement indicates cash inflow and cash outflow information of a particular time…
Q: A company reports the following income statement and balance sheet information for the curre Net…
A: Formula: Return on Total Assets = ( Net income + Interest expense ) / Average Total Assets
Q: The following information applies to the questions displayed below.] Simon Company's year-end…
A: Inventory Turnover Ratio = Sales/Average Inventory
Q: I am not sure where to start with this problem and I'm having trouble figuring out what to do
A: Cash Flow Statement: It is a financial statement prepared by the company to report the inflow and…
Q: The comparative balance sheets for 2018 and 2017 and the statement of income for 2018 are given…
A: A cash flow statement seems to be a significant tool for managing finances since it tracks a firm's…
Q: The following data were taken from the comparative balance sheet of Osborn Sisters Company for the…
A: formulas - 1) Working capital = Current assets - Current liabilities. 2) current ratio = Current…
Q: Assuming that total assets were $5,660,000 at the beginning of the current fiscal year, determine…
A: (Note: Since you have posted a multi-part question, we will solve the first three sub-parts for you.…
Q: Assets Cash $ 782,470 $ 845,170 Accounts receivable (net) 712,050 649,450…
A: Cash Flow statement is a statement which shows all the inflows and the outflows of cash and cash…
Q: The balance sheet data of Randolph Company for two recent years appears below: Assets: Year 2…
A: Horizontal Analysis Working Year 2 Year 1 Difference base year Percentage…
Q: The comparative balance sheet of Iglesias Inc. for December 31, 20Y3 and 20Y2, is shown as follows:…
A: Cash flow statement: It is a financial statement that record the cash related transactions to…
Q: The comparative balance sheet of Navaria Inc. for December 31, 20Y3 and 20Y2, is shown as follows:…
A: In the above question we have asked to prepare Cash flow statement of Navaria Inc. from indirect…
Q: Belnap Company has provided the following partial comparative balance sheets and the income…
A: Definition: Statement of cash flows: This statement reports all the cash transactions which are…
Q: The comparative balance sheet of Whitman Co. at December 31, 20Y2 and 20Y1, is as follows: 1…
A: Financial statements are the year-end financial reports that are used to indicate the financial…
Q: The comparative balance sheet of Olson-Jones Industries Inc. for December 31, 20Y2 and 20Y1, is as…
A: Cash Flow Statement : It is the statement that indicates the net balance from the cash inflows and…
Q: The comparative balance sheet of Coulson, Inc. at December 31, 20Y2 and 20Y1, is as follows:…
A: Statement of cash flows provides information regarding the cash receipts and cash payments made by…
Q: The comparative balance sheet of Hirayama Industries Inc. for December 31, 20Y2 and 20Y1, is as…
A: Cash flow statement is a statement which shows all cash inflows and cash outflows of business during…
Q: The current assets and liabilities sections of the comparative balance sheet of Wildhorse Inc., a…
A: Working:
Q: The comparative balance sheet of Merrick Equipment Co. for Dec. 31, 20Y9 and 20Y8, is:Dec. 31, 20Y9…
A: Compute the balances of cash payments and cash receipts from operating activities as shown below:…
Q: Prepare a comparative balance sheet for both years, stating each asset as a percent of total assets…
A: The comparative balance sheet is a financial statement that shows accounting estimates for assets,…
Q: The comparative balance sheet of Whitman Co. at December 31, 20Y2 and 20Y1, is as follows: 1…
A: Solution: Introduction: A cash flow statement is one of the financial statements of a business…
Q: Items 16 through 20 are based on the following: On January 1, year 1, Polk Corp. and Strass Corp.…
A: "Since You have multiple question we will be solving first question for you,If you want any specific…
Q: The comparative balance sheet of Iglesias Inc. for December 31, 20Y3 and 20Y2, is shown as follows:…
A: Statement of cash flows: It is a financial statement that shows the increase or decrease in the cash…
Q: The comparative balance sheet of Olson-Jones Industries Inc. for December 31, 20Y2 and 20Y1, is as…
A: Working: 1. Cash Dividend paid = Beginning retained earnings + Net Income - Ending retained…
Q: The following data were taken from the comparative balance sheet of Osborn Sisters Company for the…
A: Current ratio is a ratio which specifies about the ability of the company to pay-off their current…
Q: The comparative balance sheet of Hirayama Industries Inc. for December 31, 20Y2 and 20Y1, is as…
A: The cash flow statement is prepared to record the cash flow from various activities during the…
Q: The comparative balance sheet of Whitman Co. at December 31, 20Y2 and 20Y1, is as follows:…
A: Cash flow statement is a financial statement that reflect that cash position of the company Three…
Q: Assuming that total assets were $4,120,000 at the beginning of the current fiscal year, determine…
A: Accounting Ratios are defined as the metrics group which is used for evaluating the profitability as…
Q: The balance sheet for Shankland Corporation follows: 000 009 $ 000 '006 Current assets Long-term…
A: Working capital = current assets - current liabilities
Q: The comparative balance sheet of Hirayama Industries Inc. for December 31, 20Y2 and 20Y1, is as…
A: Profit on sale of land: Cost of land(107-94) = 13 Sale price = 33 Profit = 33 - 13 = 20…
Q: The comparative balance sheet of Whitman Co. at December 31, 20Y2 and 20Y1, is as follows:…
A: Prepare a statement of cash flows, using the indirect method of presenting cash flows from operating…
Q: on Company's year-end balance sheets follow. At December 31 Current Yr 1 Yr Ago 2 Yrs Ago Assets…
A: solution concept common size balance sheet The vertical common size balance sheet…
Q: A company reports the following income statement and balance sheet information for current year:…
A: Return on total assets :— It is the Ratio that determines the company's return with respect to total…
Q: The comparative balance sheet of Coulson, Inc. at December 31, 20Y2 and 20Y1, is asfollows:Dec. 31,…
A: Working note:Prepare the schedule in the changes of current assets and liabilities.
Q: The comparative balance sheet of Hirayama Industries Inc. for December 31, 20Y2 and 20Y1, is as…
A: The cash flow statement is part of the financial statements of the company. It is prepared at the…
Q: The comparative balance sheet of Harris Industries Inc. at December 31, 20Y4 and 20Y3, is as…
A: A cash flow statement forms a part of financial statements of the company and is prepared to shows…
Q: Swasey Company provided the following partial comparative balance sheets and the income statement…
A: The cash flow statement shows the cash inflow and cash outflow due to the operating, financing, and…
Q: he comparative balance sheet of Whitman Co. at December 31, 20Y2 and 20Y1, is as follows: 1 Dec.…
A: Statement of Cash flows: It is statement of cash flows showing cash flows in operating,…
Q: Assuming that total assets were $2,565,000 at the beginning of the current fiscal year, determine…
A: a) Calculate ratio of fixed assets to long-term liabilities: Fixed assets to long-term liabilities =…
Q: The comparative balance sheet of Livers Inc. for December 31, 20Y3 and 20Y2, is shown as follows:…
A:
Q: Prepare a comparative balance sheet for both years, stating each asset as a percent of total assets…
A: Vertical analysis is a method of measuring or analyzing statements that list each line item as a…
Q: Belnap Company has provided the following partial comparative balance sheets and the income…
A: Cash flow from Operating Activities relate to the cash flow generated from operations of the…
Q: The comparative balance sheet of Whitman Co. at December 31, 20Y2 and 20Y1, is as follows:Dec. 31,…
A: Working note:Prepare the schedule in the changes of current assets and liabilities.
Q: The following data were taken from the comparative balance sheet of Osborn Sisters Company for the…
A: Working capital Current Assets - Current Liabilities Current ratio Current Assets / Current…
Q: The following financial information is taken from the balance sheets of the Peter Company and the…
A: Compute the current ratio for each firm: Particulars Peter Paul Current Assets (A) $200,000…
Q: The comparative balance sheet of Merrick Equipment Co. for December 31, 20Y9 and 20Y8, is as…
A: Statement of cash flows: It is one of the financial statement that shows the cash and cash…
how do i do PR 13-3A


Trending now
This is a popular solution!

Step by step
Solved in 2 steps with 5 images


- The following data (in millions) were taken from the financial statements of Costco Wholesale Corporation: a. For Costco, determine the amount of change in millions and the percent of change (round to one decimal place) from the prior year to the recent year for: 1. Revenue 2. Operating expenses 3. Operating income b. Comment on the results of your horizontal analysis in part (a). c. Based upon Exercise 2-23, compare and comment on the operating results of Target and Costco for the recent year.The comparative balance sheet of Canace Products Inc. for December 31, 20Y6 and 20Y5, is as follows:The comparative balance sheet of Whitman Co. at December 31, 20Y2 and 20Y1, is as follows:Dec. 31, 20Y2 Dec. 31, 20Y1AssetsCash . . . . . . . . . . . . . . . . . . . . . . . . . . . . . . . . . . . . . . . . . . . . . . . . . . . . . . . . . $ 918,000 $ 964,800Accounts receivable (net) . . . . . . . . . . . . . . . . . . . . . . . . . . . . . . . . . . . . . . 828,900 761,940Inventories . . . . . . . . . . . . . . . . . . . . . . . . . . . . . . . . . . . . . . . . . . . . . . . . . . . 1,268,460 1,162,980Prepaid expenses . . . . . . . . . . . . . . . . . . . . . . . . . . . . . . . . . . . . . . . . . . . . . . . 29,340 35,100Land . . . . . . . . . . . . . . . . . . . . . . . . . . . . . . . . . . . . . . . . . . . . . . . . . . . . . . . . . . . 315,900 479,700Buildings . . . . . . . . . . . . . . . . . . . . . . . . . . . . . . . . . . . . . . . . . . . . . . . . . . . . . . . 1,462,500 900,900Accumulated depreciation—buildings . . . . . . . . . . . . . . . . . . . . . . . . . . .…
- The comparative balance sheet of Harris Industries Inc. at December 31, 20Y4 and 20Y3, is as follows: Dec. 31, 20Y4 Dec. 31, 20Y3AssetsCash $443,240 $360,920Accounts receivable (net) 665,280 592,200Inventories 887,880 1,022,560Prepaid expenses 31,640 25,200Land 302,400 302,400Buildings 1,713,600 1,134,000Accumulated depreciation—buildings (466,200) (414,540)Machinery and equipment 781,200 781,200Accumulated depreciation—machinery and equipment…The following data were taken from the comparative balance sheet of Osborn Sisters Company for the years ended December 31, 20Y9 and December 31, 20Y8: Dec. 31, 20Y9 Dec. 31, 20Y8Cash $399,800 $300,000 Temporary investments 426,700 328,700 Accounts and notes receivable (net) 392,500 358,300 Inventories 548,600 444,200 Prepaid expenses 299,400 166,800 Total current assets $2,067,000 $1,598,000 Accounts payable $307,400 $329,000 Accrued liabilities 222,600 141,000 Total current liabilities $530,000 $470,000 a. Determine for each year (1) the working capital, (2) the current ratio, and (3) the quick ratio. Round ratios to one decimal place. 20Y9 20Y8Working capital $$Current ratio Quick ratio b. The liquidity of Osborn Sisters Company has from 20Y8 to the 20Y9. The working capital, current ratio, and quick ratio have all . Most of these changes are the result of .The comparative balance sheet of Whitman Co. at December 31, 20Y2 and 20Y1, is as follows: Dec. 31, 20Y2 Dec. 31, 20Y1 Assets Cash $ 866,790 $ 932,340 Accounts receivable (net) 788,780 719,440 Inventories 1,196,170 1,100,820 Prepaid expenses 27,740 32,940 Land 298,180 450,730 Buildings 1,378,200 849,450 Accumulated depreciation-buildings (390,060) (364,050) Equipment 485,400 429,060 Accumulated depreciation-equipment (133,490) (149,950) Total assets $4,517,710 $4,000,780 Liabilities and Stockholders' Equity Accounts payable (merchandise creditors) $ 858,360 $ 905,800 Bonds payable 252,990 0 Common stock, $20 par 298,000 110,000 Paid-in capital: Excess of issue price over par-common stock 715,000 527,000 Retained earnings 2,393,360 2,457,980 Total liabilities and stockholders’ equity $4,517,710 $4,000,780 The noncurrent asset, noncurrent…
- The comparative balance sheet of Navaria Inc. for December 31, 20Y3 and 20Y2, is shown as follows: 1 Dec. 31, 20Y3 Dec. 31, 20Y2 2 Assets 3 Cash $626,170.00 $585,760.00 4 Accounts receivable (net) 227,840.00 208,880.00 5 Inventories 641,390.00 616,790.00 6 Investments 0.00 240,820.00 7 Land 327,380.00 0.00 8 Equipment 704,290.00 554,020.00 9 Accumulated depreciation-equipment (167,160.00) (148,930.00) 10 Total assets $2,359,910.00 $2,057,340.00 11 Liabilities and Stockholders’ Equity 12 Accounts payable $424,670.00 $404,080.00 13 Accrued expenses payable 43,080.00 52,050.00 14 Dividends payable 24,920.00 19,300.00 15 Common stock, $4 par 140,000.00 102,000.00 16 Paid-in capital: Excess of issue price over par—common stock 417,400.00 280,600.00 17 Retained earnings 1,309,840.00 1,199,310.00 18…The comparative balance sheet of Navaria Inc. for December 31, 20Y3 and 20Y2, is shown as follows: 1 Dec. 31, 20Y3 Dec. 31, 20Y2 2 Assets 3 Cash $626,170.00 $585,760.00 4 Accounts receivable (net) 227,840.00 208,880.00 5 Inventories 641,390.00 616,790.00 6 Investments 0.00 240,820.00 7 Land 327,380.00 0.00 8 Equipment 704,290.00 554,020.00 9 Accumulated depreciation-equipment (167,160.00) (148,930.00) 10 Total assets $2,359,910.00 $2,057,340.00 11 Liabilities and Stockholders’ Equity 12 Accounts payable $424,670.00 $404,080.00 13 Accrued expenses payable 43,080.00 52,050.00 14 Dividends payable 24,920.00 19,300.00 15 Common stock, $4 par 140,000.00 102,000.00 16 Paid-in capital: Excess of issue price over par—common stock 417,400.00 280,600.00 17 Retained earnings 1,309,840.00 1,199,310.00 18…he comparative balance sheet of Whitman Co. at December 31, 20Y2 and 20Y1, is as follows: Dec. 31, 20Y2 Dec. 31, 20Y1 Assets Cash $ 782,470 $ 845,170 Accounts receivable (net) 712,050 649,450 Inventories 1,079,810 993,740 Prepaid expenses 25,040 29,730 Land 269,170 406,880 Buildings 1,244,130 766,820 Accumulated depreciation-buildings (352,110) (328,640) Equipment 438,180 387,320 Accumulated depreciation-equipment (120,500) (135,370) Total assets $4,078,240 $3,615,100 Liabilities and Stockholders' Equity Accounts payable (merchandise creditors) $ 774,870 $ 817,680 Bonds payable 228,380 0 Common stock, $20 par 267,000 99,000 Paid-in capital: Excess of issue price over par-common stock 644,000 476,000 Retained earnings 2,163,990 2,222,420 Total liabilities and stockholders' equity $4,078,240 $3,615,100 The noncurrent asset, noncurrent…
- The following data were taken from the comparative balance sheet of Osborn Sisters Company for the years ended December 31, 20Y9 and December 31, 20Y8: Dec. 31, 20Y9 Dec. 31, 20Y8 Cash $295,200 $218,900 Temporary investments 315,000 239,800 Accounts and notes receivable (net) 289,800 261,300 Inventories 405,000 324,000 Prepaid expenses 345,000 126,000 Total current assets $1,650,000 $1,170,000 Accounts payable $290,000 $315,000 Accrued liabilities 210,000 135,000 Total current liabilities $500,000 $450,000The following data were taken from the comparative balance sheet of Osborn Sisters Company for the years ended December 31, 20Y9 and December 31, 20Y8: Dec. 31, 20Y9 Dec. 31, 20Y8 Cash $360,800 $273,600 Temporary investments 385,000 299,700 Accounts and notes receivable (net) 354,200 326,700 Inventories 495,000 405,000 Prepaid expenses 355,000 135,000 Total current assets $1,950,000 $1,440,000 Accounts payable $290,000 $315,000 Accrued liabilities 210,000 135,000 Total current liabilities $500,000 $450,000 a. Determine for each year (1) the working capital, (2) the current ratio, and (3) the quick ratio. Round ratios to one decimal place. 20Y9 20Y8 Working capital $fill in the blank 1 $fill in the blank 2 Current ratio fill in the blank 3 fill in the blank 4 Quick ratio fill in the blank 5 fill in the blank 6The comparative balance sheet of Iglesias Inc. for December 31, 20Y3 and 20Y2, is shown as follows: 1 Dec. 31, 20Y3 Dec. 31, 20Y2 2 Assets 3 Cash $626,100.00 $585,190.00 4 Accounts receivable (net) 228,630.00 208,060.00 5 Inventories 641,030.00 617,620.00 6 Investments 0.00 239,830.00 7 Land 328,160.00 0.00 8 Equipment 705,110.00 553,850.00 9 Accumulated depreciation-equipment (166,840.00) (147,700.00) 10 Total assets $2,362,190.00 $2,056,850.00 11 Liabilities and Stockholders’ Equity 12 Accounts payable $423,690.00 $404,660.00 13 Accrued expenses payable 42,340.00 53,240.00 14 Dividends payable 23,050.00 18,680.00 15 Common stock, $4 par 156,000.00 93,000.00 16 Excess of paid-in capital over par 417,000.00 279,200.00 17 Retained earnings 1,300,110.00 1,208,070.00 18 Total liabilities and…


