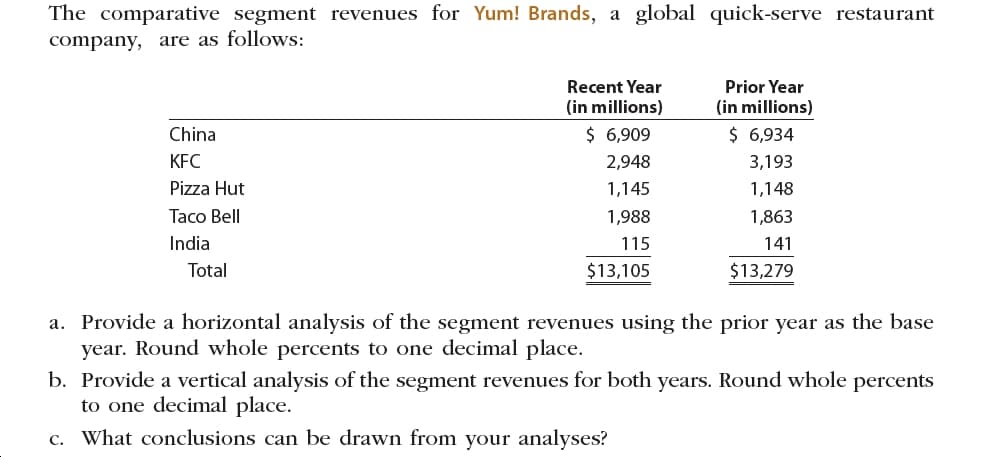
The comparative segment revenues for Yum! Brands, a global quick-serve restaurant company, are as follows: Recent Year Prior Year (in millions) (in millions) $ 6,909 $ 6,934 China KFC 2,948 3,193 Pizza Hut 1,145 1,148 Taco Bell 1,863 1,988 India 115 141 Total $13,105 $13,279 a. Provide a horizontal analysis of the segment revenues using the prior year as the base year. Round whole percents to one decimal place. b. Provide a vertical analysis of the segment revenues for both years. Round whole percents to one decimal place. c. What conclusions can be drawn from your analyses?
Q: Payton Company has the following segment revenues for the two most recent fiscal years. Segment…
A: Percentage = Segment Revenue / Total revenues
Q: Vertical analysis of income statement For 20Y2, Tri-Comic Company initiated a sales promotion…
A: Comprehensive income statement is the part of financial statements which shows the profit or loss…
Q: Payton Company has the following segment revenues for the two most recent years. Segment Current…
A: Financial Statement Analysis: The financial statement analysis is the process of analyzing the…
Q: A comparative income statement is given below for McKenzie Sales, Ltd., of Toronto: McKenzie…
A: Formula: Each individual line item Percentage = ( Each individual line item / Sales ) x 100
Q: Comparing Income Statements and Balance Sheets of Competitors Following are selected income…
A: comparison using Percentage of sale / Percentage of Total Asset is an analysis in which each line…
Q: A comparative income statement is given below for McKenzie Sales, Ltd., of Toronto: McKenzie Sales,…
A: The common size income statement is prepared as comparing all the elements of income statement with…
Q: Common-Sized Income Statement Revenue and expense data for the current calendar year for Sorenson…
A: In common size income statement each line item in income statement is shown as percentage of value…
Q: Markle's Inc. had the following transactions during the year: total sales = $610,000; sales…
A: Sales revenue: It is the revenue earned by a business on selling the goods or providing services to…
Q: Mauka, Inc. provided the following income statement for last year: Sales $24,350,735 Cost of goods…
A: Times interest earned ratio = Earnings before interest and taxesInterest expense
Q: Revenue and expense data for the current calendar year for Tannenhill Company and for the…
A: The revenue and expense data of Company T are given along with the electronics industry averages.…
Q: Revenue and expense data for Innovation Quarter Inc. for two recent years are as follows: Current…
A: Gross Profit - Selling expenses - Administrative expenses = Operating Income Operating Income -…
Q: Payton Company has the following segment revenues for the two most recent fiscal years. Current Year…
A: Vertical analysis: The comparison of an item of a financial statement against the total amount of…
Q: Vertical Analysis Revenue and expense data for Innovation Quarter Inc. for two recent years are as…
A: The income statement is prepared to estimate the net income or loss incurred during the period.
Q: Revenue and expense data for the current calendar year for Tannenhill Company and for the…
A: A common size income statement is similar to a regular income statement, except that each variable…
Q: Prepare an income statement in comparative form, stating each item for both years as a percent of…
A: We have the following information:
Q: Payton Company has the following segment revenues for the two most recent years. Segment Current…
A: A component in a business which will generate revenues by itself for production is called segment…
Q: Nu Company reported the following pretax data for its first year of operations. Net sales Cost of…
A: 1. For answering this question we are required to Prepare a Trading A/c. 2. Gross Profit=…
Q: a. Prepare a common-sized income statement comparing the results of operations for Dawg Electronics…
A: Common size statement is the technique of analyzing the financial statements to check its financial…
Q: quarter Inc comparative income tax for the years ended December 31st Sales Cost of goods Selling…
A: A comparative income statement is an income statement that deals with and compares multiple periods…
Q: ayton Company has the following segment revenues for the two most recent fiscal years. Segment…
A: Vertical analysis is an approach for analysis which shows how much percent out of total is part of a…
Q: The Coca-Cola Company is organized geographically and defines reportable operating segments as…
A: Financial statement analysis Financial statement analysis are analyzed to understand the…
Q: Revenue and expense data for Innovation Quarter Inc. for two recent years are as follows: Current…
A: Vertical analysis is an investigation used to analyze the authentic information. It demonstrates the…
Q: The data shown were obtained from the financial records of Italian Exports, Inc., for March:…
A: The budgeted income statement will be prepared by the company to arrive at the profit or loss for…
Q: A condensed income statement for Northeast Airlines and a partially completed vertical analysis are…
A: Income left to an entity after subtracting all the expenses from the revenue earned is called net…
Q: Gulf Controls, Inc., has a net profit margin of 10 percent and earnings after taxes of $600,000. Its…
A: Industry Average Ratios: Industry average ratios are used to measure the financial performance of…
Q: The following income statements were drawn from the annual reports of the Atlanta Company and the…
A: Gross margin percentage = Gross margin * 100 / Net Sales Return on sales ratio = Net Income * 100 /…
Q: Revenue and expense data for Innovation Quarter Inc. for two recent years are as follows: Current…
A: Preparation of comparative income statement with other requirement are as follows.
Q: Swank Clothiers had sales of $442,000 and cost of goods sold of $328,000. a. What is the gross…
A: Given: Sales= $ 4,42,000 Cost of good sold = $3,28,000
Q: Assume the following sales data for a company: Current year$832,402 Preceding year608,082 What is…
A: The % increase in sales is calculated as increase in sales in current year divided by previous year…
Q: Revenue and expense data for the current calendar year for Tannenhill Company and for the…
A: The differences between the industry and company net income will be due to differences in the cost…
Q: Revenue and expense data for the current calendar year for Sorenson Electronics Company and for the…
A: COMMON SIZE INCOME STATEMENT IS STATEMENT IN WHICH EVERY LINE ITEM IN INCOME STATEMENT IS EXPRESSED…
Q: Minnie Co. does business in three segments: Theme Parks, Movie Production, and Merchandise. The…
A: Vertical analysis: The comparison of an item of a financial statement against the total amount of…
Q: Vertical analysis Amazon.com, Inc.is the largest Internet retailer in the United States. Amazon's…
A: Vertical analysis of financial statements is the one that shows the relationship between the items…
Q: Revenue and expense data for the current calendar year for Tannenhill Company and for the…
A: Income statement is a statement which records the revenue and expenses of an undertaking for a…
Q: Payton Company has the following segment revenues for the two most recent fiscal years. Segment…
A: Comparative balance sheet used to compare the financial statement of two or more periods. It is…
Q: the image snap 5 shows the data table and snap 6 has the quesitons, I just dont understand how to…
A: The table provides data useful for various analysis. The information on the products -wise sales at…
Q: Starship Corporation reported the following geographical segment revenues for a recent and a prior…
A: Formula: Increase / ( Decrease ) amount = Recent year - prior year Deduction of prior year amount…
Q: Revenue and expense data for the current calendar year for Tannenhill Company and for the…
A: >Common Size Financial Statements show the % value based on specified amount.--For Income…
Q: A company's sales in the last year in its three different markets were as follows $ Market 1 100,000…
A: Pie chart means a circle which use to represent the portion of various item under studies. Total of…
Q: Ziehart Pharmaceuticals reported Net Sales of $178,000 and Cost of Goods Sold of $58,000.Candy…
A: GP% = (sales - COGS)/sales GP% for Ziehart Pharmaceuticals = ($178000-$58000)/$178000 = 0.6742 or…
Q: Coke and Pepsi are well-known international brands. Coca-Cola Co. sells more than $34.5 billion each…
A: The profitability ratio represents the profit of the company relative to the balance sheet, income,…
Q: Starbucks Corporation reported the following geographical segment revenues for a recent and a prior…
A: Horizontal analysis of segment revenue uses one year as the base year and then the change in…
Q: The condensed income statements through income from operations for Amazon.com, Inc., Best Buy, Inc.,…
A: 1. Prepare comparative common-sized income statements for each company. Round percentages to one…
Q: Revenue and expense data for the current calendar year for Tannenhill Company and for the…
A: Common size income statement is income statement which shows all items of the income statement as…
Q: 3. The following data represent the ratios for the BMA industry for 2014: 4 times Sales to…
A: Working notes: (As per our guidelines we are supposed to answer only 1st question.) 1)Sales to…
Trending now
This is a popular solution!
Step by step
Solved in 3 steps with 2 images
- Juroe Company provided the following income statement for last year: Juroes balance sheet as of December 31 last year showed total liabilities of 10,250,000, total equity of 6,150,000, and total assets of 16,400,000. Required: 1. Calculate the return on sales. (Note: Round the percent to two decimal places.) 2. CONCEPTUAL CONNECTION Briefly explain the meaning of the return on sales ratio, and comment on whether Juroes return on sales ratio appears appropriate.Starship Corporation reported the following geographical segment revenues for a recent and a prior fiscal year: Recent Year(in millions, rounded) Prior Year(in millions, rounded) Americas $10,479 $8,073 EMEA* 1,217 1,295 China/Asia Pacific 2,396 1,130 Channel Development** 1,731 1,546 Other 2,236 1,695 Total $18,059 $13,739 *Europe, Middle East, and Africa **Sells packaged coffee and teas globally a. Prepare a horizontal analysis of the segment data using the prior year as the base year. Round all percents to one decimal place. Enter all amounts in millions. If required, use minus sign to indicate the decreasing values. Starship Corporation Horizontal Analysis Recent Year (in millions) Prior Year (in millions) Increase (Decrease)Amount Increase (Decrease)Percent Americas $10,479 $8,073 $fill in the blank 15396ff9101df9f_1 fill in the blank 15396ff9101df9f_2% EMEA 1,217 1,295 fill in the blank 15396ff9101df9f_3 fill…Revenue and expense data for Innovation Quarter Inc. for two recent years are as follows: Current Year Previous Year Sales $ 2,920,000 $2,150,000 Cost of goods sold 1,769,520 1,182,500 Selling expenses 332,880 322,500 Administrative expenses 449,680 279,500 Income tax expense 169,360 116,100 A. Prepare an income statement in comparative form, stating each item for both years as a percent of sales. Round your percentages answers to one decimal place. Enter all amounts as positive numbers. B. Comment on the significant changes disclosed by the comparative income statement. Innovation Quarter Inc. Comparative Income Statement For the Years Ended December 31 1 Current year Current year Previous year Previous year 2 Amount Percent Amount Percent 3 Sales $2,920,000.00 $2,150,000.00 4 Cost of goods sold 1,769,520.00 1,182,500.00 5 Gross profit $1,150,480.00…
- Revenue and expense data for Innovation Quarter Inc. for two recent years are as follows: Current Year Previous Year Sales $ 2,720,000 $2,050,000 Cost of goods sold 1,675,520 1,111,100 Selling expenses 320,960 319,800 Administrative expenses 424,320 262,400 Income tax expense 152,320 118,900 A. Prepare an income statement in comparative form, stating each item for both years as a percent of sales. Round your percentages answers to one decimal place. Enter all amounts as positive numbers. B. Comment on the significant changes disclosed by the comparative income statement.Revenue and expense data for Innovation Quarter Inc. for two recent years are as follows: Current Year Previous Year Sales $488,000 $415,000 Cost of goods sold 312,320 232,400 Selling expenses 68,320 74,700 Administrative expenses 78,080 62,250 Income tax expense 9,760 16,600 a. Prepare an income statement in comparative form, stating each item for both years as a percent of sales. If required, round percentages to one decimal place. Enter all amounts as positive numbers.A company's sales in the last year in its three different markets were as follows$Market 1 100,000Market 2 149,000Market 3 51,000Total 300,000In a pie chart representing the proportion of sales made by each region what would be the angle of thesection representing Market 3?A 17 degreesB 50 degreesC 61 degreesD 120 degrees
- Vertical analysis income statement Revenue expense data for Innovation quarter Inc for two recent years as follows. Sales Cost of goods. Selling expenses Administrative expenses Income tax expense Current year. 4,000,000 2,280,000 600,000 520,000 240,000 Previous year 3,600,000 1,872,000 648,000 360,000 216,000 A. Prepare an income statement in comparative form, stating to each item for both of years as a percent of sales. Round to the nearest whole percentage. Innovation quarter Inc comparative income tax for the years ended December 31st Sales Cost of goods Selling expenses Administrative expenses Income tax expense $ % $ % $ % $ % $ % $ % $ % $ % B. The vertical analysis indicates that the cost of the goods sold as a percent of sales by 5 percentage points, while selling expenses by 3% percentage and administrative expenses by 3% percentage points. Thus net income as…Payton Company has the following segment revenues for the two most recent fiscal years. Segment Current Year (in millions) Prior Year (in millions) China $790 $640 Canada 330 242 Other countries 213 167 Total revenues $1,333 $1,049 Prepare a vertical analysis of the segment data. Calculate the percentage to four decimal places, then round your answer to one decimal place. For percentages, do not enter the percent sign. Payton Company Vertical Analysis Segment Current Year Amount (in millions) Current Year Percent Prior Year Amount (in millions) Prior Year Percent China $790 % $640 % Canada 330 242 Other countries 213 167 Total revenues $1333 % $1049 %Papa’s Pizza is the market leader and Pizza Prince is an up-and-coming player in the highly competitive delivery pizza business. The companies reported the following selected financial data ($ in thousands): Papa’s Pizza Pizza PrinceNet sales $ 24,128 $ 1,835Net income 2,223 129Total assets, beginning 14,998 919Total assets, ending 15,465 1,157Required:1. Calculate the return on assets, profit margin, and asset turnover ratio for Papa’s Pizza.2. Calculate the return on assets, profit margin, and asset turnover ratio for Pizza Prince.3. Which company has the higher profit margin and which company has the higher asset turnover?
- Jill Barksalot owns Jill's Jams, a condiment conglomerate focused on world dominance. She sells a variety of jellies and jams that are just to die for mwhahaha. Using the provided data on her last several years of sales, prepare a statement of trend percentages using 2017 as the base year. (in millions) 2017 2018 2019 2020 Sales 13,241 14,122 11,957 13,244 Cost of goods sold 8,987 9,534 8,272 9,101 Gross margin 4,254 4,588 3,685 4,143 2017 2018 2019 2020 Sales Cost of Goods Sold Gross MarginVertical Analysis of Income Statement Revenue and expense data for Innovation Quarter Inc. for two recent years are as follows: Current Year Previous Year Sales $4,000,000 $3,600,000 Cost of goods sold 2,280,000 1,872,000 Selling expenses 600,000 648,000 Administrative expenses 520,000 360,000 Income tax expense 240,000 216,000 a. Prepare an income statement in comparative form, stating each item for both years as a percent of sales. Round to the nearest whole percentage. Innovation Quarter Inc. Comparative Income Statement For the Years Ended December 31 Current yearAmount Current yearPercent Previous yearAmount Previous yearPercent Sales $4,000,000 % $3,600,000 % Cost of goods sold (2,280,000) % (1,872,000) % $ % $ % Selling expenses $(600,000) % $(648,000) % Administrative expenses (520,000) % (360,000) % $ % $ % $ % $ % Income tax expense (240,000) % (216,000) % $ % $ % b.…Revenue and expense data for Innovation Quarter Inc. for two recent years are as follows: Current Year Previous YearSales $4,000,000 $3,600,000Cost of goods sold 2,280,000 1,872,000Selling expenses 600,000 648,000Administrative expenses 520,000 360,000Income tax expense 240,000 216,000a. Prepare an income statement in comparative form, stating each item for both years as a percent of sales. Round to the nearest whole percentage.b. Comment on the significant changes disclosed by the comparative income statement.