The comparisons of Scholastic Aptitude Test (SAT) scores based on the highest level of education attained by the test taker's parents are provided. A research hypothesis was that students whose parents had attained a higher level of education would on average score higher on the SAT. The overall mean SAT math score was 514. SAT math scores for independent samples of students follow. Two samples are contained in the Excel Online file below. The first sample shows the SAT math test scores for students whose parents are college graduates with a bachelor's degree. The second sample shows the SAT math test scores for students whose parents are high school graduates but do not have a college degree. Use the Excel Online spreadsheet below to answer the following questions. Due to a recent change by Microsoft you will need to open the XLMiner Analysis ToolPak add-in manually from the home ribbon. Screenshot of ToolPak X Open spreadsheet a. Formulate the hypotheses that can be used to determine whether the sample data support the hypothesis that students show a higher population mean math score on the SAT if their parents attained a higher level of education. #1 population mean math score parents college grads. 142 = population mean math score parents high school grads. Ho: M1-14₂5 H₂:1-1₂ 0 0 b. What is the point estimate of the difference between the means for the two populations? points [higher if parents are college grads. c. Compute the t-value, degrees of freedom, and p-value for the hypothesis test. (to 4 decimals) t-value Degrees of freedom p-value 2.6223 22 0.0077 Check My Work 18 d. At a .05, what is your conclusion? We can reject Ho. Reset Problem (to 4 decimals)
The comparisons of Scholastic Aptitude Test (SAT) scores based on the highest level of education attained by the test taker's parents are provided. A research hypothesis was that students whose parents had attained a higher level of education would on average score higher on the SAT. The overall mean SAT math score was 514. SAT math scores for independent samples of students follow. Two samples are contained in the Excel Online file below. The first sample shows the SAT math test scores for students whose parents are college graduates with a bachelor's degree. The second sample shows the SAT math test scores for students whose parents are high school graduates but do not have a college degree. Use the Excel Online spreadsheet below to answer the following questions. Due to a recent change by Microsoft you will need to open the XLMiner Analysis ToolPak add-in manually from the home ribbon. Screenshot of ToolPak X Open spreadsheet a. Formulate the hypotheses that can be used to determine whether the sample data support the hypothesis that students show a higher population mean math score on the SAT if their parents attained a higher level of education. #1 population mean math score parents college grads. 142 = population mean math score parents high school grads. Ho: M1-14₂5 H₂:1-1₂ 0 0 b. What is the point estimate of the difference between the means for the two populations? points [higher if parents are college grads. c. Compute the t-value, degrees of freedom, and p-value for the hypothesis test. (to 4 decimals) t-value Degrees of freedom p-value 2.6223 22 0.0077 Check My Work 18 d. At a .05, what is your conclusion? We can reject Ho. Reset Problem (to 4 decimals)

Glencoe Algebra 1, Student Edition, 9780079039897, 0079039898, 2018
18th Edition
ISBN:9780079039897
Author:Carter
Publisher:Carter
Chapter10: Statistics
Section: Chapter Questions
Problem 25SGR

Related questions
Question
Transcribed Image Text:Question 1
6.25/10
Submit
Video
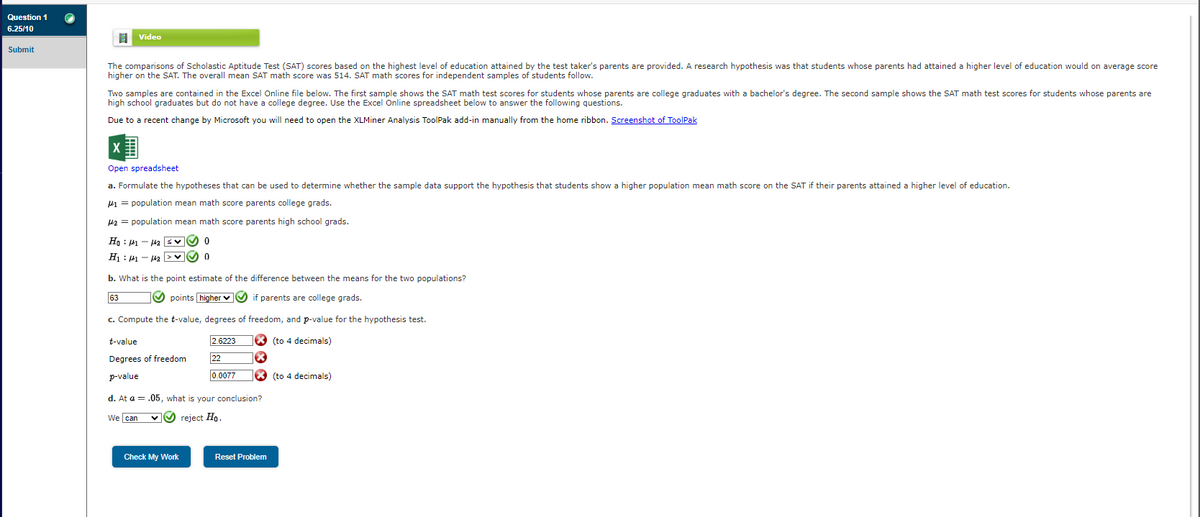
The comparisons of Scholastic Aptitude Test (SAT) scores based on the highest level of education attained by the test taker's parents are provided. A research hypothesis was that students whose parents had attained a higher level of education would on average score
higher on the SAT. The overall mean SAT math score was 514. SAT math scores for independent samples of students follow.
Two samples are contained in the Excel Online file below. The first sample shows the SAT math test scores for students whose parents are college graduates with a bachelor's degree. The second sample shows the SAT math test scores for students whose parents are
high school graduates but do not have a college degree. Use the Excel Online spreadsheet below to answer the following questions.
Due to a recent change by Microsoft you will need to open the XLMiner Analysis ToolPak add-in manually from the home ribbon. Screenshot of ToolPak
X
Open spreadsheet
a. Formulate the hypotheses that can be used to determine whether the sample data support the hypothesis that students show a higher population mean math score on the SAT if their parents attained a higher level of education.
1 = population mean math score parents college grads.
142 = population mean math score parents high school grads.
Ho 141 142 ✔✔ 0
:
H₁:141-142
O
b. What is the point estimate of the difference between the means for the two populations?
63
✔points higher ✔✔✔ if parents are college grads.
c. Compute the t-value, degrees of freedom, and p-value for the hypothesis test.
(to 4 decimals)
t-value
Degrees of freedom
p-value
2.6223
Check My Work
22
0.0077
d. At a = .05, what is your conclusion?
We can
✓✔ reject Ho.
Reset Problem
(to 4 decimals)
Transcribed Image Text:File Home Insert Share Page Layout
D✓ 0
H17
▲
1
2
3
4
5
6
7
8
9
10
11
12
13
14
15
16
17
18
19
20
21
22
23
24
25
26
27
4
< $ * * * * * * * * * * * * * * * *
Y
3
Arial
x ✓ fx
B
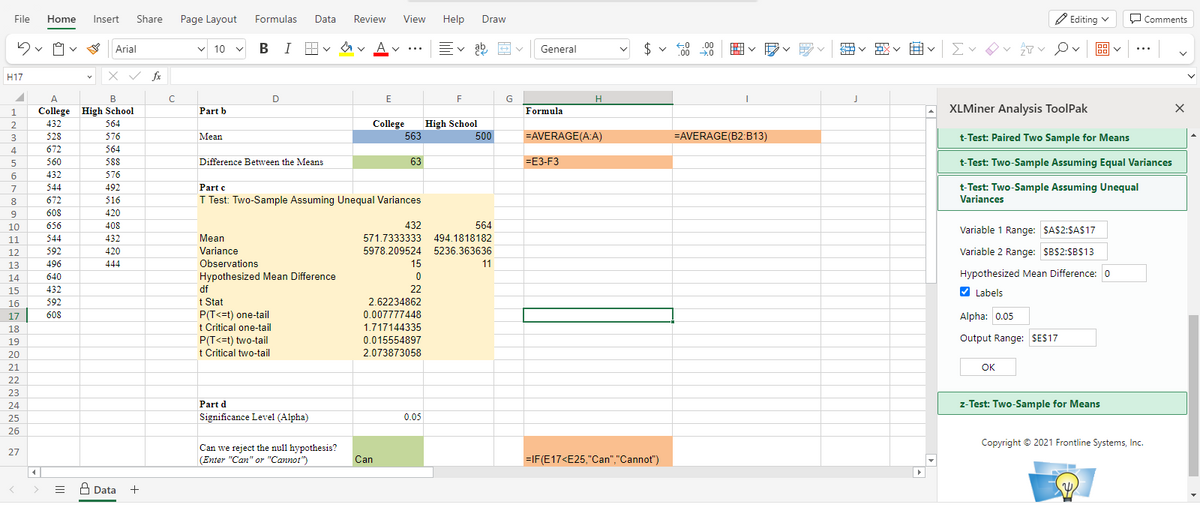
College High School
564
576
564
588
576
492
516
420
408
432
420
444
Data
+
C
✓ 10 ✓
Part b
Mean
Formulas Data Review View Help
BIF A
Mean
Variance
Difference Between the Means
D
Observations
Hypothesized Mean Difference
df
t Stat
P(T<=t) one-tail
t Critical one-tail
P(T<=t) two-tail
t Critical two-tail
Part c
T Test: Two-Sample Assuming Unequal Variances
Part d
Significance Level (Alpha)
Can we reject the null hypothesis?
(Enter "Can" or "Cannot")
E
College
563
63
Can
432
15
0
22
2.62234862
0.007777448
1.717144335
0.015554897
2.073873058
Ev
571.7333333 494.1818182
5978.209524 5236.363636
0.05
F
High School
Draw
500
564
11
G
General
Formula
H
|=AVERAGE(A:A)
=E3-F3
$
=IF(E17<E25,"Can","Cannot")
←0
.00
.00
0
囲くく
=AVERAGE(B2:B13)
聞く朗く曲くM<
J
Σ✓ ✓ ✓ Ov 88
00
Editing ✓
XLMiner Analysis ToolPak
t-Test: Paired Two Sample for Means
t-Test: Two-Sample Assuming Equal Variances
t-Test: Two-Sample Assuming Unequal
Variances
Variable 1 Range: $A$2:$A$17
Variable 2 Range: $B$2:$B$13
Hypothesized Mean Difference: 0
✔Labels
Alpha: 0.05
Output Range: $E$17
OK
z-Test: Two-Sample for Means
Comments
Copyright © 2021 Frontline Systems, Inc.
Y
Expert Solution
This question has been solved!
Explore an expertly crafted, step-by-step solution for a thorough understanding of key concepts.

This is a popular solution!

Trending now
This is a popular solution!

Step by step
Solved in 3 steps with 5 images

Follow-up Questions
Read through expert solutions to related follow-up questions below.
Follow-up Question
The below is incorrect.
(c) t-value=2.1107; df=26; p-value=0.0223

Transcribed Image Text:10.2 Excel Activity 2a - Hypothesis Test for the Difference of Two Means (Structured)
Question 1
6.25/10
Submit
Video
The comparisons of Scholastic Aptitude Test (SAT) scores based on the highest level of education attained by the test taker's parents are provided. A research hypothesis was that students whose parents had attained a higher level of education would on average score
higher on the SAT. The overall mean SAT math score was 514. SAT math scores for independent samples of students follow.
Two samples are contained in the Excel Online file below. The first sample shows the SAT math test scores for students whose parents are college graduates with a bachelor's degree. The second sample shows the SAT math test scores for students whose parents are
high school graduates but do not have a college degree. Use the Excel Online spreadsheet below to answer the following questions.
Due to a recent change by Microsoft you will need to open the XLMiner Analysis ToolPak add-in manually from the home ribbon. Screenshot of ToolPak
Open spreadsheet
a. Formulate the hypotheses that can be used to determine whether the sample data support the hypothesis that students show a higher population mean math score on the SAT if their parents attained a higher level of education.
#1 = population mean math score parents college grads.
#2 = population mean math score parents high school grads.
Ho 141 142V✔ 0
H₁:141-14₂ ✔ 0
b. What is the point estimate of the difference between the means for the two populations?
63
points higher
if parents are college grads.
c. Compute the t-value, degrees of freedom, and p-value for the hypothesis test.
(to 4 decimals)
t-value
Degrees of freedom
p-value
2.1107
Check My Work
26
0.0223
X (to 4 decimals)
d. At a = .05, what is your conclusion?
We can ✔✔✔ reject Ho.
Reset Problem
Solution
Recommended textbooks for you
Glencoe Algebra 1, Student Edition, 9780079039897…
Algebra
ISBN:
9780079039897
Author:
Carter
Publisher:
McGraw Hill
Glencoe Algebra 1, Student Edition, 9780079039897…
Algebra
ISBN:
9780079039897
Author:
Carter
Publisher:
McGraw Hill