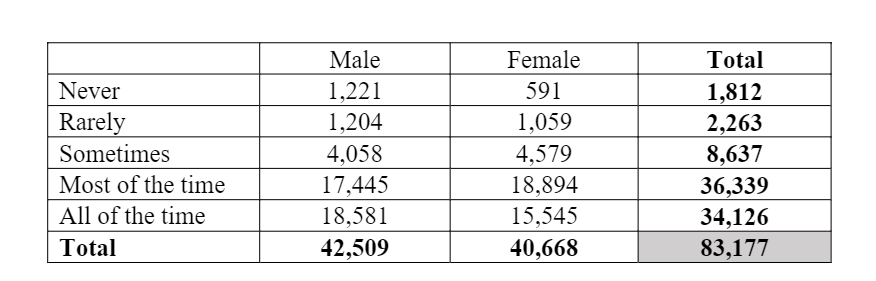
The contingency table below presents summary data from the Ohio Healthy Youth Environments Survey(OHYES!) carried out in 2019. A sample of student s in grades 7-12 were asked how often they felt safe at school the previous year. (Source: Ohio Department of Health, Ohio Public Health Information Warehouse)Using the data from the table, if a student is randomly selected, determine the following probabilities. (show work and round final answer to 3 decimal places) a)P(Never) b)P(Female) c)P(Sometimes and Female)


The contingency table below presents summary data from the Ohio Healthy Youth Environments Survey(OHYES!) carried out in 2019. A sample of student s in grades 7-12 were asked how often they felt safe at school the previous year.
(Source: Ohio Department of Health, Ohio Public Health Information Warehouse)Using the data from the table, if a student is randomly selected, determine the following probabilities. (show work and round final answer to 3 decimal places)
a)P(Never)
b)P(Female)
c)P(Sometimes and Female)
Probability: Probability is a chance factor that occurs at every outcome of a random experiment.it is defined as the ratio of number of favorable outcomes to the total number of possible outcomes and it is denoted as
p= s/n
Here’s is the number of favorable outcomes and n is the total number of possible outcomes
The probability value will always lie between 0 and 1.

Trending now
This is a popular solution!

Step by step
Solved in 2 steps


