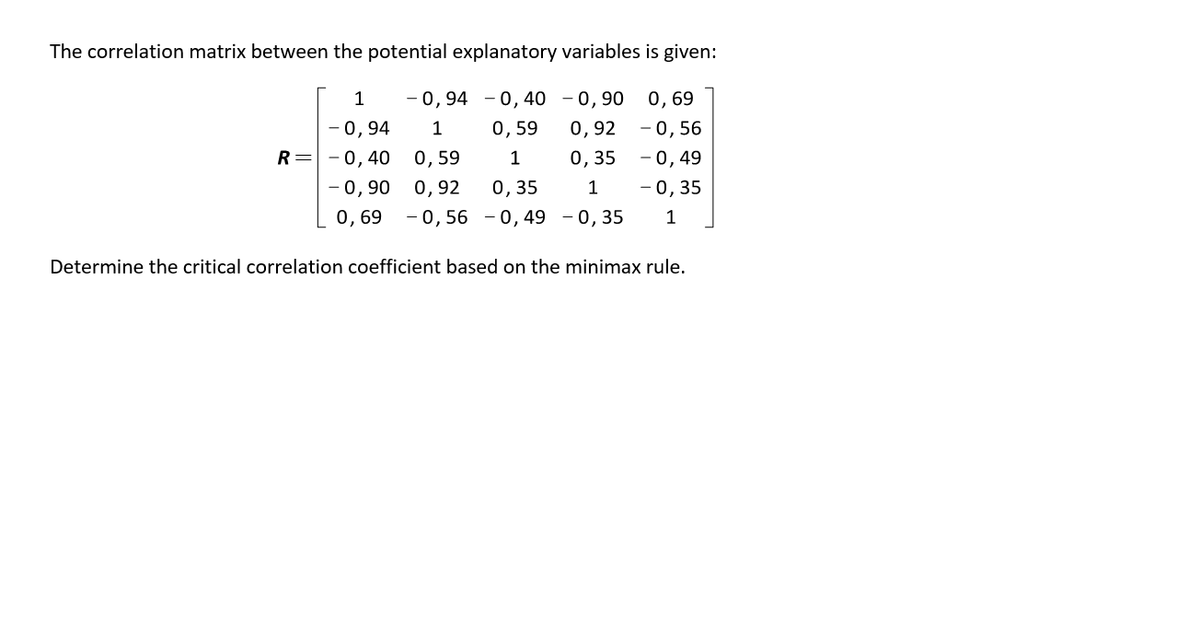
The correlation matrix between the potential explanatory variables is given: 1 -0,94 -0,40 -0,90 0,69 1 -0,94 0,59 0,92 -0,56 1 0,35 -0,49 -0,90 0,92 0,35 1 -0, 35 0,69 -0,56 -0,49 -0,35 1 Determine the critical correlation coefficient based on the minimax rule. R=0,40 0,59


Q: The national average SAT score is roughly 1500. We would like to see if the high school seniors who…
A: Given information:
Q: A probability density function for the random variable X is given by Pi = ki, where k is a constant.…
A: The provided information is as follows:The probability density function for the random variable is…
Q: Given the following least squares estimates Ct = a₁ +0.92Yt + e₁t Ct = a₂ +0.84Ct-1 + ezt Ct−1 = a3…
A: The least squares estimate:The least squares estimates and from needed to be determined.
Q: Suppose that the mean daily viewing time of television is 8.35 hours per hosehold. Use a normal…
A:
Q: Provide the process of proving the method of moments or maximum likelihood estimation for the…
A: The binomial distribution has a pmf given below,
Q: Just as with the method of moments, we can use percentile matching to estimate multiple parameters…
A: In the context of percentile matching for parameter estimation in a distribution with parameters,…
Q: 20 dice were rolled. die that shows a number different from 1 is rolled again. Find the probability…
A: No. of dice rolledIf a die shows , it'll be rolled again.The probability distribution function of…
Q: You are conducting a study to see if the proportion of voters who prefer Candidate A is…
A: Answer Given,The population proportion, p = 0.2Favorable success [x] = 95Dample size [n] = 390
Q: Customers 1 123 2 3 4567 69 8 10 11 12 13 14 15 16 17 18 19 20 21 22 23 24 25 26 27 28 29 30 Age…
A: In this case, the objective is to validate if the variables "watch preference" and "age" are…
Q: 13. The following table shows the age (in months) and the number of hours slept in a day of 10…
A: You have attached multiple questions in one question ,We can provide one solution in one…
Q: A health statistics agency in a certain country tracks the number of adults who have health…
A: Given,22.4% of people in the county are under age 18. That is, P(under age 18) = 22.4% = 0.224And…
Q: Can you show your work
A:
Q: By canceling their relationship with Supplier A, it's possible that the supermarket chain commited a…
A: Type 1 error refers to rejecting the null hypothesis, when in fact it is true. In this case, it…
Q: is the true proportion and you plan to randomly survey 180 grocery shopp havior. What is the…
A:
Q: 1.16 Income and education in US counties: The scatterplot below shows the relationship between per…
A: The objective of the question is to identify the explanatory and response variables in a given…
Q: Mark has accumulated $52,627 in savings and wishes to invest this money sensibly. The types of…
A: Amount in savings = $52,627The Pie chart indicates the recommended categories of investment.
Q: The owner of a small brewery is using Winters method to forecast his quarterly beer sales. He has…
A: The Winter method is used for forecasting quarterly beer sales in a small brewery.The smoothing…
Q: You wish to test the following claim (H) at a significance level of a = 0.02. Ho:p = 0.22 Ha:p> 0.22…
A: The sample size for the study is Let, the number of successful observationThe objective is to test…
Q: Question 2 Suppose that we have data y = (v₁.....yn). Each data-point y, is assumed to be generated…
A: Given that each data point from the data follows the probability density function:
Q: Consider the linear model Yi = B0 + B1X1i + B2X2i + ui where ui is the error term and where…
A: The linear model: The error termThe observations are i.i.d. Whether the OLS estimators and of the…
Q: A random-number generator simulates realizations from a Unif(0, 1) distribution. distribution. Find…
A: The random-number generator simulates realizations from a distribution.A transformation h is needed…
Q: Class interval (MK) 1-5000 5001-10000 10001-15000 15001-20000 20001-25000 Income midpoint, 2500.5…
A: ClassFrequency1 - 5000505001 - 100003510001 - 150002015001 - 200001020001 - 250005
Q: Bird Chicken 1 Chicken 2 Chicken 3 Goose 1 Goose 2 Goose 3 Duck 1 Duck 2 Duck 3 Number of Eggs 4 6…
A: The mean is the sum of all observations divided by the total number of observations.
Q: Q7. The following are the ages of 30 patients admitted to the emergency room in a hospital.…
A: The ages of patients admitted to the emergency room in a hospital…
Q: Alternatives Add a new building Extend hours for existing building Do Nothing nswer High Demand…
A: The given data is as follows:Decision tableState of natureAlternativesHigh demand Moderate demand…
Q: Match each scatterplot shown below with one of the four specified correlations. 1 O 00 00 O LO O a.…
A: Correlation coefficient define the strength and direction of relationship- sign shows negative…
Q: please answer in excel Jim’s Outfitters, Inc. makes custom fancy shirts for cowboys. The shirts…
A: Given the following data: ShirtDefects (x)1621394125260778394108It is required to determineThe…
Q: Module 03 Activity – Exercises in measurement and validity 1 You have just started a new diet…
A: The variable which has an integer value is called a discrete random variable. The variable which has…
Q: 6) In 7 card stud, 3 cards are dealt face down to each player: a) What is the probability that all 3…
A: The probability () is given by the formula:
Q: Consider the simple regression model Y =Bot Bix tự t = 1,2, ...,T where u = pu₁_1 + & with |p| < 1…
A: When the two variables are associated with each other one variable is used to estimate the value of…
Q: �0:�=9.395 �1:�≠9.395 Your sample consists of 38 subjects, with a mean of 9.7 and standard…
A: The hypothesis test is the statistical procedure used to test the claim statistically. The…
Q: You intend to conduct a test of independence for a contingency table with 5 categories in the column…
A: From the provided information,Categories in column variable (c) = 5Categories in row variable (r) =…
Q: he number of regular seasons wins for each Major League Baseball team in 2012 are listed. (Source:…
A: The given observations are as follows:95, 90, 73, 69, 93, 66, 85, 88, 72, 68, 89, 94, 93, 75, 94,…
Q: Kolmogorov-Smimov statistic given by D₂ sup| F(x)-S₂(x) | x 1. The two sided I where F(x) is a…
A: To prove that the two-sided Kolmogorov-Smirnov statistic Dn is completely distribution-free, we need…
Q: From a survey of 200 coworkers you find that 84 would like the company to provide on-site day care.…
A:
Q: Let the height data (105)represent sample. Use an appropriate statistical test to check whether the…
A: The objective of this question is to use a statistical test to determine if the population mean is…
Q: 5. Assume that the measurement vector y is obtained from ß by y = WB + 8 where E(BB') = R₁ E…
A: The measurement vector can be obtained from by The expectations,It is needed to prove that the…
Q: please show the work for the problems with an explanation versus just shwoing calculated data.
A: To check the relationship b/w age and miles on the car.
Q: �0:�=9.395 �1:�≠9.395 Your sample consists of 38 subjects, with a mean of 9.7 and standard…
A: Sample consists of 38 subjects, with a mean of 9.7 and standard deviation of 2.01.
Q: Out of 400 people sampled, 244 preferred Candidate A. Based on this, estimate what proportion of the…
A: X=244, n=400
Q: Q6. 30 army inductees were given a blood test to determine their blood type. The data set is AB B B…
A: The data on the blood type of the army inductees. NoBloot…
Q: Consider again problem 3 of Sect. 4.1 and the data given there. A painting process was investigated…
A: The variable under study is the paint thickness on a particular item.Let, Thickness of paintThe…
Q: 4.3.3 Suppose we estimate that a forest can support a population of 10,000 deer and that the…
A:
Q: Show proof of the following. Provide all derivations used. 2. Consider a multinomial distribution…
A: 2) To prove that the distribution of X1 in a multinomial distribution with three possible outcomes…
Q: ↑ The data set shows the ages of all participants in two yoga classes. Complete parts (a) through…
A: The question contains two different groups of age of participants in the 3:00 PM class and the 8:00…
Q: 0.6 PO 0.2 CO -0.2 -0.4 -0.6 -0.8 PACF Plot for Second Difference of Log Transformation in Quarterly…
A: The objective is to determine the appropriate order of AR(p) and MA(q) from the provided ACF and…
Q: answer all parts
A: The algorithm being carried out by the code is called the Metropolis-Hastings algorithm, which is a…
Q: If you were to play the raffle 100 times what is your net gain?
A:
Q: EANS TABLES - d20_hrsrelax tvi_tvhours. Case Processing Summary Cases Excluded Included N Percent N…
A: The question aims to assess if there's a difference in the number of hours per day men and women…
Q:
A: The objective of these questions is to calculate the probability of various events. Probability is…

Step by step
Solved in 3 steps with 11 images

- Calculate the Pearson product-moment correlation coefficient, r, between these two sets of data: 1, 1, 2, 2, 2 4, 3, 3, 3, 4What six quantities are needed to compute a correlation coefficient?In a sample of size200,the correlation coefficient is 0.45. Is thecorrelation coefficient is significant under the population. α=0.05
- An urn contains 10 white balls and 8 red balls. 2 balls are selected at random. Let X denote the number of red balls drawn and let Y denote the number of white balls drawn. Find the correlation coefficient between X and Y.Compute the linear correlation coefficient. The linear correlation coefficient for the four pieces of data isAn example of a reserch situation where using a partial correlation may be hepfu.
- If a scatterplot shows strong, negative association and nonlinear form then the correlation r is very close to -1. Select one: True or False1. If someone owns an electric car it is represented by a one and if they don’t it is represented by a zero. If someone owns an electric car and their yearly salary in pounds for four people are (0,80000), (0, 17000), (0, 37000) and (1, 58000) calculate the correlation coefficient.2. How might we interpret this result?Create a correlation matrix Table in APA style to report the correlations among these variables, along with their Ms and SDs.
- Compute the value of correlation coefficient of using data in table 1 for the number of hrs. a person works per week and thenumber of accidents or injuries that the person has over a peroid of one week. Table :1 Hrs.Worked ( x ) No. of accidents( y ) 30 2 42 3 25 4 44 8 56 5Give a plausible example of a three-variable research problem in which partial correlation would be a useful analysis. Define X1, X2, and Y. Make sure that you indicate which of your three variables is the "controlled for" variable ( X2). What results might you expect to obtain for this partial correlation, and how would you interpret your results (e.g., spurious correlation, mediation, moderation, and so on)?Sarah is conducting a correlation analysis. She creates a correlation matrix with 5 variables, using data from a sample of 37 people. She has decided to conduct her analysis as a one-tailed test with an alpha of .01. What is the critical value for Sarah's correlation?