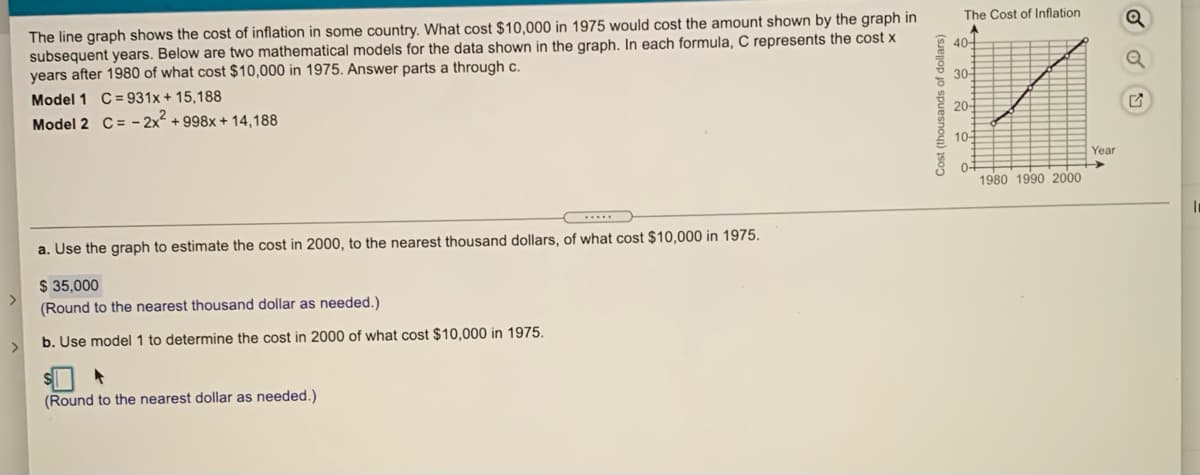
The Cost of Inflation The line graph shows the cost of inflation in some country. What cost $10,000 in 1975 would cost the amount shown by the graph in subsequent years. Below are two mathematical models for the data shown in the graph. In each formula, C represents the cost x years after 1980 of what cost $10,000 in 1975. Answer parts a through c. 40+ 30- Model 1 C = 931x + 15,188 20- Model 2 C= - 2x + 998x + 14,188 10- Year 0- 1980 1990 2000 a. Use the graph to estimate the cost in 2000, to the nearest thousand dollars, of what cost $10,000 in 1975. $ 35,000 > (Round to the nearest thousand dollar as needed.) b. Use model 1 to determine the cost in 2000 of what cost $10,000 in 1975. > (Round to the nearest dollar as needed.) Cost (thousands of dollars)
The Cost of Inflation The line graph shows the cost of inflation in some country. What cost $10,000 in 1975 would cost the amount shown by the graph in subsequent years. Below are two mathematical models for the data shown in the graph. In each formula, C represents the cost x years after 1980 of what cost $10,000 in 1975. Answer parts a through c. 40+ 30- Model 1 C = 931x + 15,188 20- Model 2 C= - 2x + 998x + 14,188 10- Year 0- 1980 1990 2000 a. Use the graph to estimate the cost in 2000, to the nearest thousand dollars, of what cost $10,000 in 1975. $ 35,000 > (Round to the nearest thousand dollar as needed.) b. Use model 1 to determine the cost in 2000 of what cost $10,000 in 1975. > (Round to the nearest dollar as needed.) Cost (thousands of dollars)

Glencoe Algebra 1, Student Edition, 9780079039897, 0079039898, 2018
18th Edition
ISBN:9780079039897
Author:Carter
Publisher:Carter
Chapter3: Linear And Nonlinear Functions
Section3.7: Piecewise And Step Functions
Problem 29PPS

Related questions
Question
Answer letter b
Transcribed Image Text:The line graph shows the cost of inflation in some country. What cost $10,000 in 1975 would cost the amount shown by the graph in
subsequent years. Below are two mathematical models for the data shown in the graph. In each formula, C represents the cost x
years after 1980 of what cost $10,000 in 1975. Answer parts a through c.
The Cost of Inflation
40-
30-
C = 931x + 15,188
Model 2 C= - 2x + 998x + 14,188
Model 1
20-
10-
Year
0-
1980 1990 2000
a. Use the graph to estimate the cost in 2000, to the nearest thousand dollars, of what cost $10,000 in 1975.
$ 35,000
<>
(Round to the nearest thousand dollar as needed.)
b. Use model 1 to determine the cost in 2000 of what cost $10,000 in 1975.
>
(Round to the nearest dollar as needed.)
Cost (thousands of dollars)
Expert Solution
This question has been solved!
Explore an expertly crafted, step-by-step solution for a thorough understanding of key concepts.

This is a popular solution!

Trending now
This is a popular solution!

Step by step
Solved in 2 steps with 1 images

Knowledge Booster


Learn more about
Need a deep-dive on the concept behind this application? Look no further. Learn more about this topic, algebra and related others by exploring similar questions and additional content below.Recommended textbooks for you
Glencoe Algebra 1, Student Edition, 9780079039897…
Algebra
ISBN:
9780079039897
Author:
Carter
Publisher:
McGraw Hill

Algebra: Structure And Method, Book 1
Algebra
ISBN:
9780395977224
Author:
Richard G. Brown, Mary P. Dolciani, Robert H. Sorgenfrey, William L. Cole
Publisher:
McDougal Littell

Glencoe Algebra 1, Student Edition, 9780079039897…
Algebra
ISBN:
9780079039897
Author:
Carter
Publisher:
McGraw Hill
Algebra: Structure And Method, Book 1
Algebra
ISBN:
9780395977224
Author:
Richard G. Brown, Mary P. Dolciani, Robert H. Sorgenfrey, William L. Cole
Publisher:
McDougal Littell


Elementary Algebra
Algebra
ISBN:
9780998625713
Author:
Lynn Marecek, MaryAnne Anthony-Smith
Publisher:
OpenStax - Rice University

Holt Mcdougal Larson Pre-algebra: Student Edition…
Algebra
ISBN:
9780547587776
Author:
HOLT MCDOUGAL
Publisher:
HOLT MCDOUGAL