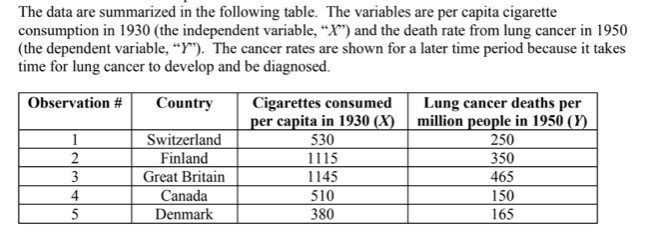
The data are summarized in the following table. The variables are per capita cigarette consumption in 1930 (the independent variable, “X") and the death rate from lung cancer in 1950 (the dependent variable, “Y"). The cancer rates are shown for a later time period because it takes time for lung cancer to develop and be diagnosed. Country Cigarettes consumed per capita in 1930 (X) | million people in 1950 (Y) |Observation # Lung cancer deaths per 1 Switzerland Finland Great Britain 530 1115 1145 250 350 2 3 4 465 150 165 Canada 510 5 Denmark 380
The data are summarized in the following table. The variables are per capita cigarette consumption in 1930 (the independent variable, “X") and the death rate from lung cancer in 1950 (the dependent variable, “Y"). The cancer rates are shown for a later time period because it takes time for lung cancer to develop and be diagnosed. Country Cigarettes consumed per capita in 1930 (X) | million people in 1950 (Y) |Observation # Lung cancer deaths per 1 Switzerland Finland Great Britain 530 1115 1145 250 350 2 3 4 465 150 165 Canada 510 5 Denmark 380

Glencoe Algebra 1, Student Edition, 9780079039897, 0079039898, 2018
18th Edition
ISBN:9780079039897
Author:Carter
Publisher:Carter
Chapter4: Equations Of Linear Functions
Section4.6: Regression And Median-fit Lines
Problem 6PPS

Related questions
Question
100%
Note: please do not use
Thank you!
Transcribed Image Text:The data are summarized in the following table. The variables are per capita cigarette
consumption in 1930 (the independent variable, “X") and the death rate from lung cancer in 1950
(the dependent variable, “Y"). The cancer rates are shown for a later time period because it takes
time for lung cancer to develop and be diagnosed.
Country
Cigarettes consumed
per capita in 1930 (X)
530
1115
1145
Lung cancer deaths per
million people in 1950 (Y)
250
350
465
Observation #
Switzerland
Finland
Great Britain
1
2
3
4
Canada
Denmark
510
150
165
5
380
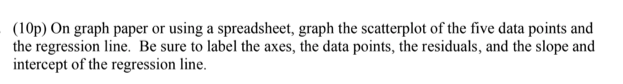
Transcribed Image Text:(10p) On graph paper or using a spreadsheet, graph the scatterplot of the five data points and
the regression line. Be sure to label the axes, the data points, the residuals, and the slope and
intercept of the regression line.
Expert Solution
This question has been solved!
Explore an expertly crafted, step-by-step solution for a thorough understanding of key concepts.

This is a popular solution!

Trending now
This is a popular solution!

Step by step
Solved in 2 steps with 3 images

Recommended textbooks for you
Glencoe Algebra 1, Student Edition, 9780079039897…
Algebra
ISBN:
9780079039897
Author:
Carter
Publisher:
McGraw Hill

Algebra & Trigonometry with Analytic Geometry
Algebra
ISBN:
9781133382119
Author:
Swokowski
Publisher:
Cengage

Glencoe Algebra 1, Student Edition, 9780079039897…
Algebra
ISBN:
9780079039897
Author:
Carter
Publisher:
McGraw Hill
Algebra & Trigonometry with Analytic Geometry
Algebra
ISBN:
9781133382119
Author:
Swokowski
Publisher:
Cengage

College Algebra
Algebra
ISBN:
9781305115545
Author:
James Stewart, Lothar Redlin, Saleem Watson
Publisher:
Cengage Learning

Functions and Change: A Modeling Approach to Coll…
Algebra
ISBN:
9781337111348
Author:
Bruce Crauder, Benny Evans, Alan Noell
Publisher:
Cengage Learning

Algebra and Trigonometry (MindTap Course List)
Algebra
ISBN:
9781305071742
Author:
James Stewart, Lothar Redlin, Saleem Watson
Publisher:
Cengage Learning