The data available below give the amount of CO, produced in 40 nations along with the level of economic activity during a recent year. CO, emissions are given in millions of metric tons. Economic activity is given by the grosso (GDP), a summary of overall economic output. Complete parts (a) through (d) below. E Click the icon to view the data. ... a) Make a scatterplot of CO,2 emissions and GDP. Which variable have you used as the response and which as the explanatory variable? Which scatterplot below shows the data? OA. OB. Oc. OD. 18,000 12,000 18,000 18,000 wwwww 12,000 GDP 0- 18,000 Co2 12,000 GDP 18.000 GDP Vhich variable have you used as the response and which as the explanatory variable? he response variable is V and the explanatory variable is b) Describe any association between CO, emissions and GDP. Choose the correct answer below. CO2 emissions. DA. Ignoring any outliers, there is a strong positive linear assoc GDP. OB. Ignoring any outliers, there is a strong negative linear association. OC. There is a weak negative linear association. O D. There is a nonlinear association. DE. There is no association. O F. There is a weak positive linear association. O Time Remaining: 00:5
The data available below give the amount of CO, produced in 40 nations along with the level of economic activity during a recent year. CO, emissions are given in millions of metric tons. Economic activity is given by the grosso (GDP), a summary of overall economic output. Complete parts (a) through (d) below. E Click the icon to view the data. ... a) Make a scatterplot of CO,2 emissions and GDP. Which variable have you used as the response and which as the explanatory variable? Which scatterplot below shows the data? OA. OB. Oc. OD. 18,000 12,000 18,000 18,000 wwwww 12,000 GDP 0- 18,000 Co2 12,000 GDP 18.000 GDP Vhich variable have you used as the response and which as the explanatory variable? he response variable is V and the explanatory variable is b) Describe any association between CO, emissions and GDP. Choose the correct answer below. CO2 emissions. DA. Ignoring any outliers, there is a strong positive linear assoc GDP. OB. Ignoring any outliers, there is a strong negative linear association. OC. There is a weak negative linear association. O D. There is a nonlinear association. DE. There is no association. O F. There is a weak positive linear association. O Time Remaining: 00:5

Functions and Change: A Modeling Approach to College Algebra (MindTap Course List)
6th Edition
ISBN:9781337111348
Author:Bruce Crauder, Benny Evans, Alan Noell
Publisher:Bruce Crauder, Benny Evans, Alan Noell
Chapter3: Straight Lines And Linear Functions
Section3.3: Modeling Data With Linear Functions
Problem 11E: The Kelvin Temperature Scale Physicists and chemists often use the Kelvin temperature scale. In...

Related questions
Question
Data analysis
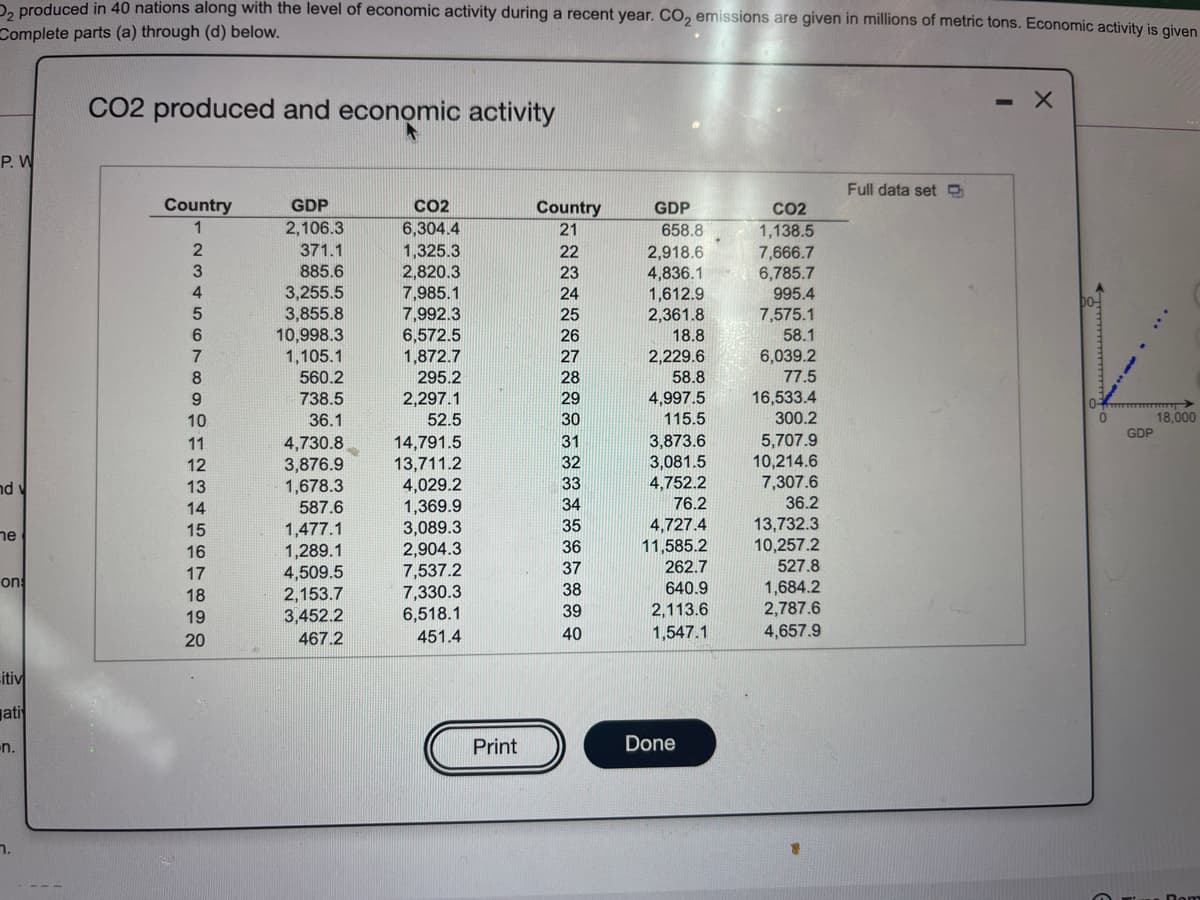
Transcribed Image Text:Da produced in 40 nations along with the level of economic activity during a recent year. CO2 emissions are given in millions of metric tons. Economic activity is given
Complete parts (a) through (d) below.
CO2 produced and economic activity
P. W
Full data set O
Country
GDP
CO2
CO2
1,138.5
7,666.7
6,785.7
995.4
Country
GDP
1
2,106.3
6,304.4
1,325.3
2,820.3
7,985.1
7,992.3
6,572.5
1,872.7
295.2
21
658.8
371.1
22
2,918.6
4,836.1
1,612.9
2,361.8
885.6
3,255.5
3,855.8
10,998.3
1,105.1
560.2
23
4
24
25
7,575.1
6.
26
18.8
58.1
27
2,229.6
58.8
6,039.2
77.5
8.
28
16,533.4
300.2
9.
738.5
2,297.1
29
4,997.5
10
36.1
52.5
30
115.5
0.
18,000
GDP
3,873.6
3,081.5
4,752.2
5,707.9
10,214.6
7,307.6
36.2
13,732.3
10,257.2
527.8
1,684.2
2,787.6
31
4,730.8
3,876.9
1,678.3
587.6
14,791.5
13,711.2
4,029.2
1,369.9
3,089.3
2,904.3
7,537.2
7,330.3
6,518.1
451.4
11
12
32
nd
13
33
14
34
76.2
4,727.4
11,585.2
262.7
640.9
35
1,477.1
1,289.1
4,509.5
2,153.7
3,452.2
ne
15
16
36
17
37
on
18
38
39
2,113.6
19
20
467.2
40
1,547.1
4,657.9
itiv
ati
n.
Print
Done
n.
Transcribed Image Text:The data available below give the amount of CO, produced in 40 nations along with the level of economic activity during a recent year. CO, emissions are given in millions of metric tons. Economic activity is given by the gross domestic prod
(GDP), a summary of overall economic output. Complete parts (a) through (d) below.
E Click the icon to view the data.
...
(a) Make a scatterplot of CO, emissions and GDP. Which variable have you used as the response and which as the explanatory variable?
Which scatterplot below shows the data?
OA.
OB.
Oc.
OD.
18,000-
Q
12,000-
18,000
18,000-
04
12,000
GDP
18,000
Co2
12,000
18,000
GDP
GDP
Which variable have you used as the response and which as the explanatory variable?
The response variable is
V and the explanatory variable is
(b) Describe any association between CO, emissions and GDP.
Choose the correct answer below.
CO2 emissions.
O A. Ignoring any outliers, there is a strong positive linear association.
GDP.
O B. Ignoring any outliers, there is a strong negative linear association.
O C. There is a weak negative linear association.
O D. There is a nonlinear association.
O E. There is no association.
O F. There is a weak positive linear association.
O Time Remaining: 00:55:31
MacBook Air
80
DII
DD
F9
F10
$11
F1
F2
F3
F4
F5
F6
F7
FB
10
#3
%23
24
19
Expert Solution
This question has been solved!
Explore an expertly crafted, step-by-step solution for a thorough understanding of key concepts.

This is a popular solution!

Trending now
This is a popular solution!

Step by step
Solved in 2 steps with 1 images

Recommended textbooks for you
Functions and Change: A Modeling Approach to Coll…
Algebra
ISBN:
9781337111348
Author:
Bruce Crauder, Benny Evans, Alan Noell
Publisher:
Cengage Learning

Glencoe Algebra 1, Student Edition, 9780079039897…
Algebra
ISBN:
9780079039897
Author:
Carter
Publisher:
McGraw Hill

Algebra and Trigonometry (MindTap Course List)
Algebra
ISBN:
9781305071742
Author:
James Stewart, Lothar Redlin, Saleem Watson
Publisher:
Cengage Learning
Functions and Change: A Modeling Approach to Coll…
Algebra
ISBN:
9781337111348
Author:
Bruce Crauder, Benny Evans, Alan Noell
Publisher:
Cengage Learning
Glencoe Algebra 1, Student Edition, 9780079039897…
Algebra
ISBN:
9780079039897
Author:
Carter
Publisher:
McGraw Hill
Algebra and Trigonometry (MindTap Course List)
Algebra
ISBN:
9781305071742
Author:
James Stewart, Lothar Redlin, Saleem Watson
Publisher:
Cengage Learning

College Algebra
Algebra
ISBN:
9781305115545
Author:
James Stewart, Lothar Redlin, Saleem Watson
Publisher:
Cengage Learning

Algebra & Trigonometry with Analytic Geometry
Algebra
ISBN:
9781133382119
Author:
Swokowski
Publisher:
Cengage

Holt Mcdougal Larson Pre-algebra: Student Edition…
Algebra
ISBN:
9780547587776
Author:
HOLT MCDOUGAL
Publisher:
HOLT MCDOUGAL