The data below describe the fat content, in grams per serving, for a sample of 20 chicken sandwiches from fast-food chains. 9 6 3 9 16 21 18 20 18 30 - 20 31 24 17 25 28 27 27 41 56 (a) Compute the first quartile (Q,) the third quartile (Q3) and the interquartile range. (b) List the five-number summary. (c) Construct a boxplot and describe the shape. (c) Which of the following is the correct boxplot? OA. HI
The data below describe the fat content, in grams per serving, for a sample of 20 chicken sandwiches from fast-food chains. 9 6 3 9 16 21 18 20 18 30 - 20 31 24 17 25 28 27 27 41 56 (a) Compute the first quartile (Q,) the third quartile (Q3) and the interquartile range. (b) List the five-number summary. (c) Construct a boxplot and describe the shape. (c) Which of the following is the correct boxplot? OA. HI

Glencoe Algebra 1, Student Edition, 9780079039897, 0079039898, 2018
18th Edition
ISBN:9780079039897
Author:Carter
Publisher:Carter
Chapter10: Statistics
Section10.3: Measures Of Spread
Problem 1GP

Related questions
Question
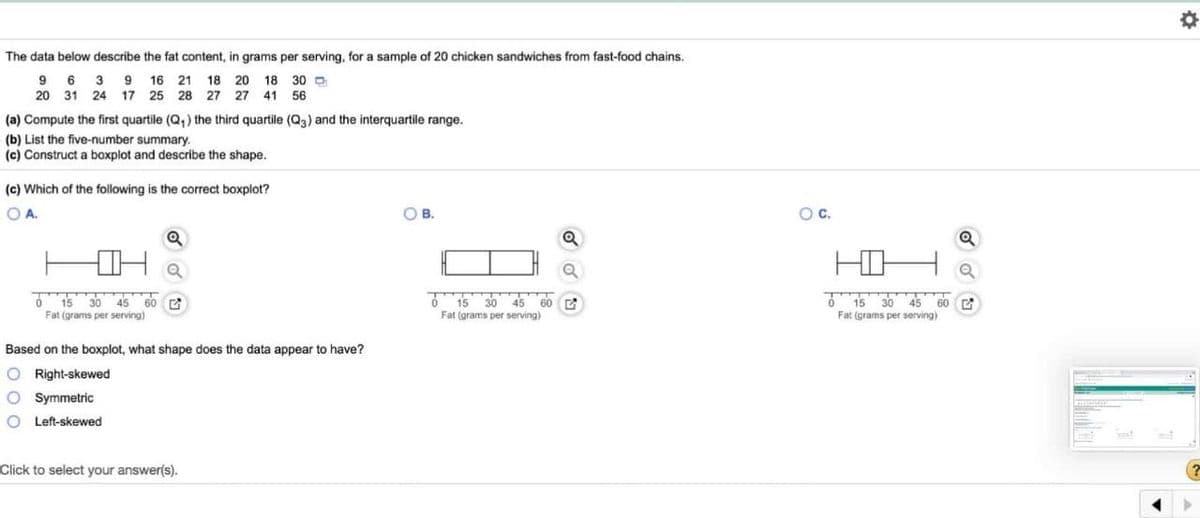
Transcribed Image Text:The data below describe the fat content, in grams per serving, for a sample of 20 chicken sandwiches from fast-food chains.
9 6 3
16 21 18 20 18 30 O
20 31 24 17 25 28 27 27 41 56
9
(a) Compute the first quartile (Q,) the third quartile (Q3) and the interquartile range.
(b) List the five-number summary.
(c) Construct a boxplot and describe the shape.
(c) Which of the following is the correct boxplot?
OA.
O B.
Oc.
15 30 45 60 C
Fat (grams per serving)
어15 30 45
어 15-30 45 60
60
Fat (grams per serving)
Fat (grams per serving)
Based on the boxplot, what shape does the data appear to have?
Right-skewed
O Symmetric
Left-skewed
Click to select your answer(s).
Expert Solution
This question has been solved!
Explore an expertly crafted, step-by-step solution for a thorough understanding of key concepts.

Step by step
Solved in 4 steps with 1 images

Recommended textbooks for you
Glencoe Algebra 1, Student Edition, 9780079039897…
Algebra
ISBN:
9780079039897
Author:
Carter
Publisher:
McGraw Hill
Glencoe Algebra 1, Student Edition, 9780079039897…
Algebra
ISBN:
9780079039897
Author:
Carter
Publisher:
McGraw Hill