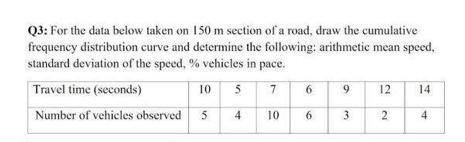
Q3: For the data below taken on 150 m section of a road, draw the cumulative frequency distribution curve and determine the following: arithmetic mean speed, standard deviation of the speed, % vehicles in pace. Travel time (seconds) 10 5 7 6 9 12 14 Number of vehieles observed 4 10 6 3 2 4
Q3: For the data below taken on 150 m section of a road, draw the cumulative frequency distribution curve and determine the following: arithmetic mean speed, standard deviation of the speed, % vehicles in pace. Travel time (seconds) 10 5 7 6 9 12 14 Number of vehieles observed 4 10 6 3 2 4

Glencoe Algebra 1, Student Edition, 9780079039897, 0079039898, 2018
18th Edition
ISBN:9780079039897
Author:Carter
Publisher:Carter
Chapter10: Statistics
Section10.4: Distributions Of Data
Problem 19PFA

Related questions
Question
Transcribed Image Text:Q3: For the data below taken on 150 m section of a road, draw the cumulative
frequency distribution curve and determine the following: arithmetic mean speed,
standard deviation of the speed, % vehicles in pace.
Travel time (seconds)
10
5
7.
6
9
12
14
Number of vehicles observed
5
4
10
3.
4
2.
6.
Expert Solution
This question has been solved!
Explore an expertly crafted, step-by-step solution for a thorough understanding of key concepts.

Step by step
Solved in 4 steps with 5 images

Recommended textbooks for you
Glencoe Algebra 1, Student Edition, 9780079039897…
Algebra
ISBN:
9780079039897
Author:
Carter
Publisher:
McGraw Hill
Glencoe Algebra 1, Student Edition, 9780079039897…
Algebra
ISBN:
9780079039897
Author:
Carter
Publisher:
McGraw Hill