The data given below show the number of overtime hours worked in one week per employee. Use the data to complete parts (a) and (b). Overtime hours Employees 0 8 X P(x) 0 1 11 1 2 31 (a) Construct a probability distribution. (b) Graph the probability distribution using a histogram and describe its shape. (a) Construct the probability distribution by completing the table below. 2 3 57 3 4 44 4 5 29 5 6 15 6 Time Remaining: 02:28:04 Next
The data given below show the number of overtime hours worked in one week per employee. Use the data to complete parts (a) and (b). Overtime hours Employees 0 8 X P(x) 0 1 11 1 2 31 (a) Construct a probability distribution. (b) Graph the probability distribution using a histogram and describe its shape. (a) Construct the probability distribution by completing the table below. 2 3 57 3 4 44 4 5 29 5 6 15 6 Time Remaining: 02:28:04 Next

College Algebra
7th Edition
ISBN:9781305115545
Author:James Stewart, Lothar Redlin, Saleem Watson
Publisher:James Stewart, Lothar Redlin, Saleem Watson
Chapter9: Counting And Probability
Section9.3: Binomial Probability
Problem 33E: Sick leave probability that a given worker at Dyno Nutrition Will call in sick on a Monday is 004....

Related questions
Question
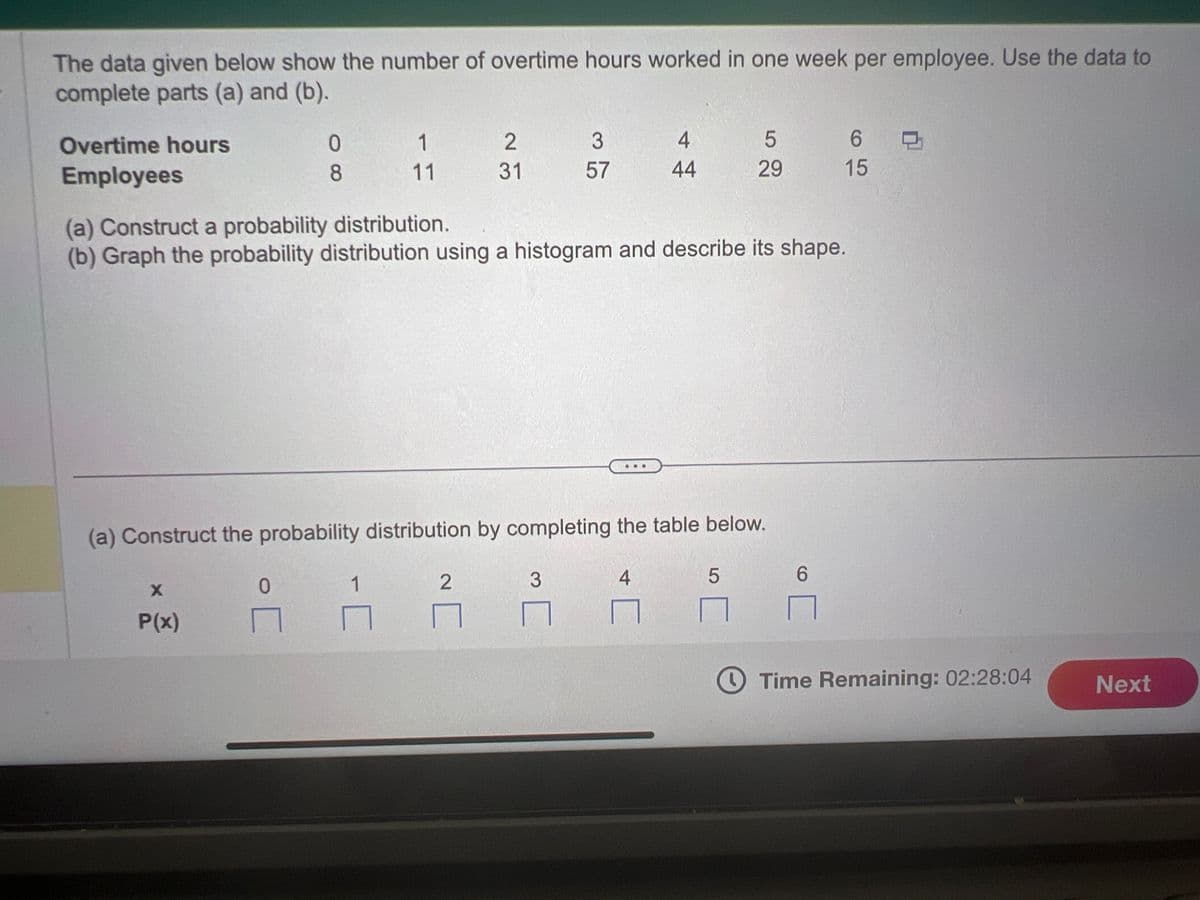
Transcribed Image Text:The data given below show the number of overtime hours worked in one week per employee. Use the data to
complete parts (a) and (b).
Overtime hours
Employees
X
P(x)
0
8
0
[
1
11
1
(a) Construct a probability distribution.
(b) Graph the probability distribution using a histogram and describe its shape.
(a) Construct the probability distribution by completing the table below.
-C
2
31
2
3
57
3
4
44
4
5
29
5
6
15
6
Time Remaining: 02:28:04
Next
Transcribed Image Text:The data given below show the number of overtime hours worked in one week per employee. Use the data to
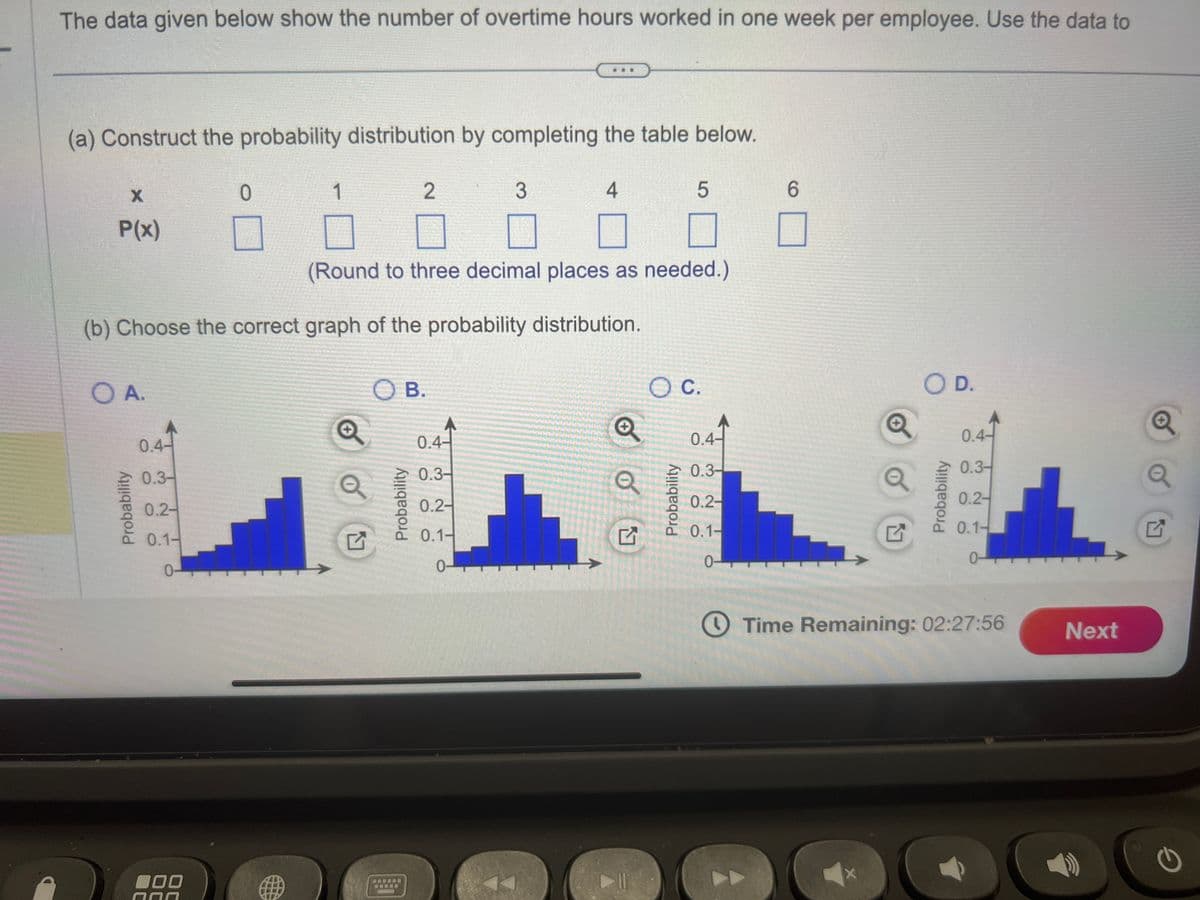
(a) Construct the probability distribution by completing the table below.
X
P(x)
O A.
Probability
0.4-
0.3-
0.2-
0.1-
0-
0
000
000
1
(b) Choose the correct graph of the probability distribution.
Q
2
G
(Round to three decimal places as needed.)
OB.
Probability
3
4
0.4-
0.3-
0.2-
0.1-
0-
✪
Q
선
5
O C.
Probability
0.41
0.3-
0.2-
0.1-
0-
6
O D.
Probability
0.4-
0.3-
0.2-
0.1-
Time Remaining: 02:27:56
L
Next
O
Q
G
Expert Solution
This question has been solved!
Explore an expertly crafted, step-by-step solution for a thorough understanding of key concepts.

Step by step
Solved in 2 steps with 1 images

Recommended textbooks for you
College Algebra
Algebra
ISBN:
9781305115545
Author:
James Stewart, Lothar Redlin, Saleem Watson
Publisher:
Cengage Learning

Algebra & Trigonometry with Analytic Geometry
Algebra
ISBN:
9781133382119
Author:
Swokowski
Publisher:
Cengage
College Algebra
Algebra
ISBN:
9781305115545
Author:
James Stewart, Lothar Redlin, Saleem Watson
Publisher:
Cengage Learning
Algebra & Trigonometry with Analytic Geometry
Algebra
ISBN:
9781133382119
Author:
Swokowski
Publisher:
Cengage