The data in the accompanying table represent the total rates of return (in percentages) for three stock exchanges over the four-year period from 2009 to 2012. Calculate the geometric mean rate of return for each of the three stock exchanges. Click the icon to view data table for total rate of return for stock market indices. i Click the icon to view data table for total rate of return for platinum, gold, and silver. a. Compute the geometric mean rate of return per year for the stock indices from 2009 through 2012.
The data in the accompanying table represent the total rates of return (in percentages) for three stock exchanges over the four-year period from 2009 to 2012. Calculate the geometric mean rate of return for each of the three stock exchanges. Click the icon to view data table for total rate of return for stock market indices. i Click the icon to view data table for total rate of return for platinum, gold, and silver. a. Compute the geometric mean rate of return per year for the stock indices from 2009 through 2012.

Glencoe Algebra 1, Student Edition, 9780079039897, 0079039898, 2018
18th Edition
ISBN:9780079039897
Author:Carter
Publisher:Carter
Chapter10: Statistics
Section10.3: Measures Of Spread
Problem 8PPS

Related questions
Question
100%
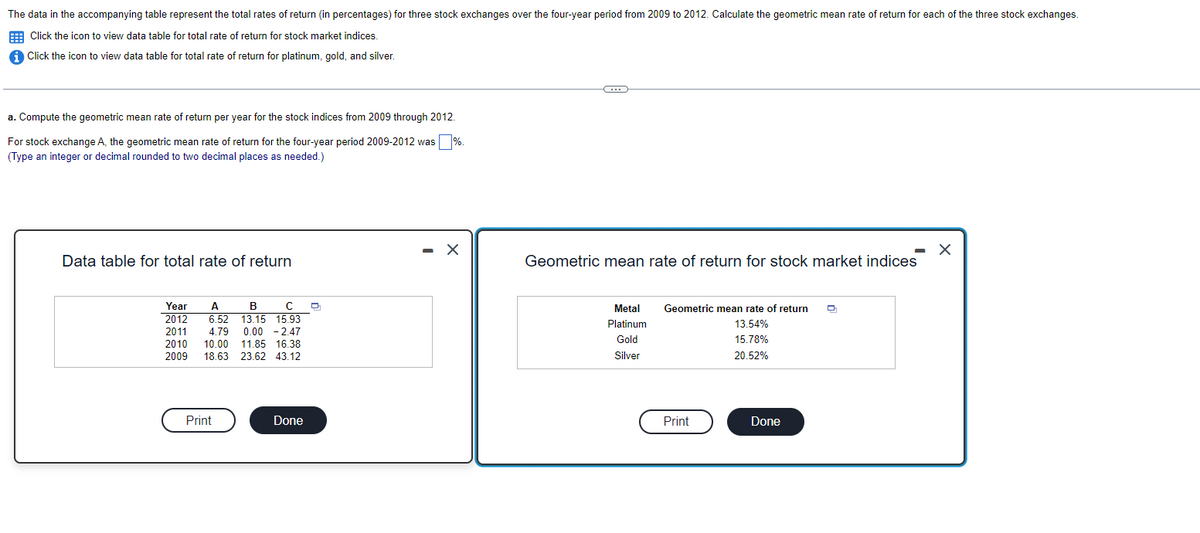
Transcribed Image Text:The data in the accompanying table represent the total rates of return (in percentages) for three stock exchanges over the four-year period from 2009 to 2012. Calculate the geometric mean rate of return for each of the three stock exchanges.
Click the icon to view data table for total rate of return for stock market indices.
Click the icon to view data table for total rate of return for platinum, gold, and silver.
a. Compute the geometric mean rate of return per year for the stock indices from 2009 through 2012.
For stock exchange A, the geometric mean rate of return for the four-year period 2009-2012 was %.
(Type an integer or decimal rounded to two decimal places as needed.)
Data table for total rate of return
Year A B C
2012 6.52 13.15 15.93
2011 4.79 0.00 -2.47
2010 10.00 11.85 16.38
2009 18.63 23.62 43.12
Print
Done
- X
C
Geometric mean rate of return for stock market indices
Metal
Platinum
Gold
Silver
Geometric mean rate of return D
13.54%
15.78%
20.52%
Print
Done
X
Expert Solution
This question has been solved!
Explore an expertly crafted, step-by-step solution for a thorough understanding of key concepts.

This is a popular solution!

Trending now
This is a popular solution!

Step by step
Solved in 5 steps with 16 images

Recommended textbooks for you
Glencoe Algebra 1, Student Edition, 9780079039897…
Algebra
ISBN:
9780079039897
Author:
Carter
Publisher:
McGraw Hill

Big Ideas Math A Bridge To Success Algebra 1: Stu…
Algebra
ISBN:
9781680331141
Author:
HOUGHTON MIFFLIN HARCOURT
Publisher:
Houghton Mifflin Harcourt
Glencoe Algebra 1, Student Edition, 9780079039897…
Algebra
ISBN:
9780079039897
Author:
Carter
Publisher:
McGraw Hill
Big Ideas Math A Bridge To Success Algebra 1: Stu…
Algebra
ISBN:
9781680331141
Author:
HOUGHTON MIFFLIN HARCOURT
Publisher:
Houghton Mifflin Harcourt