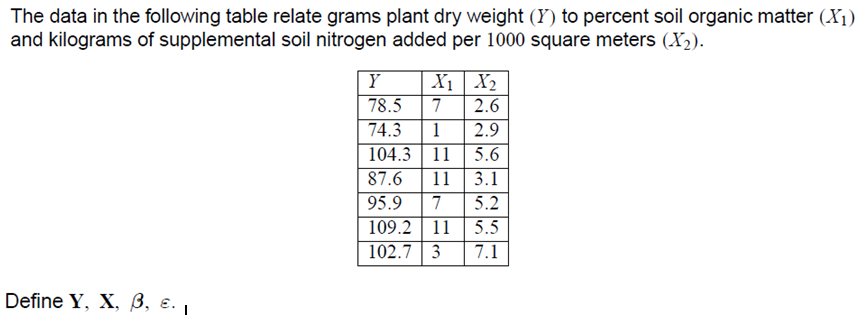
The data in the following table relate grams plant dry weight (Y) to percent soil organic matter (X1) and kilograms of supplemental soil nitrogen added per 1000 square meters (X2). Y X1 X2 7 78.5 74.3 2.6 2.9 104.3 | 11 87.6 5.6 11| 3.1 5.2 | 7 109.2 | 11 | 5.5 102.7 | 3 95.9 7.1 Define Y, X, В, е.


Q: The following data give the speeds of 13 cars (in mph) measured by radar, travelling on l-84. 73 75…
A: Solution
Q: The cumulative relative frequency plot shown was constructed using data on the percentage of college…
A: Solution: The cumulative relative frequency plot constructed using data on the percentage of college…
Q: An aerobic exercise instructor remembers the data given in the following table, which shows the…
A: Let the linear relationship between Age (X) and maximum Heart rate (Y) is given by y = A + Bx…
Q: The following table gives information on the average saturated fat (in grams) consumed per day and…
A: (c ) Use EXCEL to construct the scatter plot. EXCEL procedure: Go to EXCEL Go to Insert menu…
Q: As concrete cures it gains strength. The following data represents the 7 day and 28 day Ustrength…
A: Given: The data given is as follows x y 2300 4070 3390 5220 2430 4640 2890 4620 3330…
Q: Calculate Bowley's coefficient of Skewness. Mid values | 15 25 35 45 55 75 | 85 50 22 65 Frequency |…
A:
Q: The accompanying table shows the number of students who eamed an A, B, C, and D grade in a business…
A: Given data is Grade sophomore junior Total A 16 31 47 B 32 37 69 C 18 18 36 D 12 5 17…
Q: Complete the following table: Grade on Statistics Relative Exam Frequency Frequency .08 A: 90-100 B:…
A:
Q: From the following data of age of employecs, calculate coefficient Example: of skewness and comment…
A: Mean = ΣXi*fi/Σfi = (25*8+30*20+35*40+40*65+45*80+50*92+55*100)/(8+20+40+65+80+92+100) = 45.679 Here…
Q: 1 2 3 Households 26 406 6
A: According to the data,The number of televisions (HD) per household in a small town…
Q: Data was collected for 300 fish from the North Atlantic. The length of the fish (in mm) is…
A: Concept: Upper and lower class limit is the highest and lowest value that can be taken in an…
Q: Calculate the semi-interquartile range and quartile coefficient from the following : Age in years…
A:
Q: The data below was collected from manufacturer advertisements of their gas mileage (mpg=y). Use this…
A: HP 157 250 340 350 390 190 220 mpg 33 28 15 17 11 35 42 Correlation Coefficient (r): r =…
Q: Consider the following data relating hours spent studying (X) and average grade on course quizzes…
A:
Q: Data was collected for 300 fish from the North Atlantic. The length of the fish (in mm) is…
A: Given data was collected for 300 fish from the north atlantic. the length of the fish(in mm) is…
Q: From the data given below calculate the gross reproduction rate assuming that the ratio of female…
A: Answer:
Q: The table shows the number y of Wal-Mart stores for each year x from 2008 through 2014.Sketch a…
A: The table shows the number y of Wal-Mart stores for each year x from 2008 through 2014
Q: Find the following measures of dispersion for the data below: 15 18 1 15 18 4 3 10 8 9. 8 17 13 2 5…
A:
Q: 25. Use the following graph to find the average rate of change in U.S. energy consumption from 1982…
A: Average rate of change is the value that can be obtained by change in value with respect to time.…
Q: The data below represents twenty weeks worth of income that Laurence earned from his lawn mowing…
A:
Q: Find the measures of center for following. Data Frequency 40 44 1 45 49 50 54 55 59 60 64 5 11 16 65…
A: Hi! Thanks for posting the question. Since there are more than one question, we will answer first…
Q: The table contains data on the admission price (in dollars) for one-day tickets to 10 theme parks in…
A: Given values: 55, 61, 42, 44, 28, 48, 64, 44, 40, 42. Arrange the data in ascending order: 28, 40,…
Q: Find the 7h decile and 60h percentile from the following data : Wages ( $) 30-40 40-50 50 60 60 70…
A:
Q: The following table shows the weekly total sales (in dollars) at a small roadside fruit stand for…
A: Statistical hypothesis testing is an important method in inferential statistics. It is used to test…
Q: In a town, a sample of 24 recently sold houses is collected. We would like to predict the sale price…
A: Hello! As you have posted more than 3 sub parts, we are answering the first 3 sub-parts. In case…
Q: The numbers of hours worked (per week) by 400 statistics students are shown below. Number of…
A:
Q: The box plots show the target heart rates of men 20-40 years old and men 50-70 years old. Target…
A: The Statement A is false
Q: Consider the following data relating hours spent studying (X) and average grade on course quizzes…
A: The table shows the hours spent studying and the average grade on course quizzes.
Q: Data was collected for 300 fish from the North Atlantic. The length of the fish (in mm) is…
A: Here Frequency distribution table is in class limit form. We need to convert Class limit to class…
Q: 4. The data in the table shows the age, t (in years), and the corresponding height, h (in inches),…
A:
Q: Do the data in Table 1 suggest a linear relation between the pressure P and temperature T of a gas?…
A:
Q: You get a data about the "mean household income" for your city, and decide to display it…
A: The variable of interest is " mean household income".
Q: The data represent the heights in feet and the number of stories of the tallest buildings in a city.…
A: Introduction :- Here we have to find out the correlation coefficient between Heights and stories.…
Q: Calculate mean from the following data : Midpoints 2 3 4 5 7 8 9. Frequency 2 60 101 152 205 155 70…
A:
Q: Find out the combined mean for the following data. X1 X2 60 25 70 35 40 30 30
A:
Q: Calculate the range of the data. 16 22 17 18 22 19 21 20 18…
A:
Q: HW.1 X y 58 Find y. (10) for the following data in the below table. 6 9 14 17 10
A: We will use Lagrange's Interpolating polynomial to find y10.
Q: What type of data is the total distance represented in the table below? Time (minutes)Total Distance…
A: It is an important part of statistics. It is widely used.
Q: Consider the set of data below for the yield (in kg) of tomatoes with fertilizer and the numb of…
A: a) Scatter diagram:
Q: The cholesterol level (in mg/dL) of 5 patients who had heart attacks was measured two days after the…
A: patient d= L1-L2 d2 1 -47 2209 2 -4 16 3 -12 144 4 14 196 5 24 576 Total -25 3141
Q: Consider the following data relating hours spent studying (X) and average grade on course quizzes…
A: Given values are
Q: In order for applicants to work for the foreign-service department, they must take a test in the…
A:
Q: The accompanying table shows the number of students who earned an A, B, C, and D grade in a…
A: Note: " Since you have posted many sub-parts. we will solve the first three sub-parts for you. To…
Q: A pediatrician wants to determine the relation that may exist between a child's height and head…
A: The independent variable is Height. The dependent variable is Head Circumference. This is simple…
Q: The chart shows the number of hours that 25 students in a 1st-period class slept on Monday night.…
A: Solution : Given : Number of hours that 25 students in a 1st period class slept on Monday night. For…
Q: The following data give the speeds of 13 cars (in mph) measured by radar, travelling on l-84. 73 75…
A: Calculate Percentiles-35 from the following data73,75,69,68,78,69,74,76,72,79,68,77,70
Q: 4. From the data given below, find out the value of Y when X 35 10 20 30 40 50 60 70 90
A: Given the table X Y 10 50 20 60 30 70 40 90 Here, we are going to use the linear…
Q: A professor grades 50 exams and creates a relative frequency table of the exam scores. Exam score…
A: Introduction: The median is the middle-most observation in the data set. About half or 50% of all…
Q: The data below shows the number jobs that a sample of people had in their life time: 8 8 12 12 | 12…
A: The data set is given below: 8, 8, 12, 12, 12, 12, 13, 14, 15, 15 (a) The given data is…
Q: 6. The table below shows the relationship between Sustained Winds (x) and Storm pressure ((y) for…
A: Definition used - Function - Function is a type of relation in which each input has a…


Trending now
This is a popular solution!

Step by step
Solved in 2 steps with 7 images


- A worker with a weight of 65 kg and a body surface area of 1.74 , performs physical work activities in several work environments as shown in the following table. The work activities of these workers require energy and a measured metabolic rate of 400 W/m2. During their work activities, the worker wears a coverall made of polyolefin and wears a headgear (1) Calculate the average WBGT of the work environment. (2) Perform an analysis related to the heat stress experienced by the worker, if the worker performs his work activities for 75% of his total working time and the rest is rest, (note: use TLV from ACGIH and ISO 7243)A survey of 90 recently delivered women on the rolls of a county welfare department revealed that 27 had a history of intrapartum or postpartum infection. What is the critical value of z if we need to conclude that the population proportion with a history of intrapartum or postpartum infection is less than 0.25.The mean ±1 sd of ln [calcium intake (mg)] among 25 females, 12 to 14 years of age, below the poverty level is 6.56 ± 0.64. Similarly, the mean ± 1 sd of ln [calcium intake (mg)] among 40 females, 12 to 14 years of age, above the poverty level is 6.80 ± 0.76. *8.7 Suppose an equal number of 12- to 14-year-old girls below and above the poverty level are recruited to studydifferences in calcium intake. How many girls should be recruited to have an 80% chance of detecting a significant difference using a two-sided test with α = .05? *8.8 Answer Problem 8.7 if a one-sided rather than a twosided test is used. *8.9 Using a two-sided test with α = .05, answer Problem 8.7, anticipating that two girls above the poverty level will be recruited for every one girl below the poverty level who is recruited.
- Suppose μ1 and μ2 are true mean stopping distances at 50 mph for cars of a certain type equipped with two different types of braking systems. The data follows: m = 8, x = 114.6, s1 = 5.03, n = 8, y = 129.3, and s2 = 5.38. Calculate a 95% CI for the difference between true average stopping distances for cars equipped with system 1 and cars equipped with system 2. (Round your answers to two decimal places.) ,Records for the last 15 years have shown that the average rainfall in a certain region of the country, for the month of March, to be 1.20 inches, with s = 0.45 inches. A second region had an average rainfall of 1.35 inches, with s = 0.54. estimate the difference of the true average rainfalls in those two regions as a 95% C.I. with the assumption of normal populations and unequal variances.The following table shows education expenditure in the United States as a percentage of total federal spending in 2009, 2015, and 2019. Year t (year since 2000) 9 15 19 Percentage P(t) 25 27 26 Compute and interpret the average rate of change of P(t) over the period 2009–2019 (that is, [9, 19]) and over the period [15, 19]. Be sure to state the units of measurement. (a) Compute the average rate of change over the period 2009–2019 (that is, [9, 19]). ---Select--- % per year years dollars Interpret the average rate of change. U.S. education expenditure, as a percentage of total federal spending, is projected to have increased by this amount per year during 2009-2019. U.S. education expenditure, as a percentage of total federal spending, is projected to have decreased by this amount per day during 2009-2019. U.S. education expenditure, as a percentage of total federal spending, is projected to have increased by this amount per month during 2009-2019. U.S.…
- A physician wants to test if temperature has an effect on heart rate. In order to do this, she compares the heart rate in beats per minute of several random volunteers after a period of time in a room with a temperature of 50∘F and after a period of time in a room with a temperature of 75∘F. Suppose that data were collected for a random sample of 11 volunteers, where each difference is calculated by subtracting the heart rate in beats per minute in the 50∘F room from the heart rate in beats per minute in the 75∘F room. Assume that the populations are normally distributed. The test statistic is t≈5.627, α=0.05, the corresponding rejection regions are t<−2.228 and t>2.228, the null hypothesis is H0:μd=0, and the alternative hypothesis is Ha:μd≠0. Which of the following statements are accurate for this hypothesis test in order to evaluate the claim that the true mean difference between the heart rate in the 75∘F room and the heart rate in the 50∘F room is significantly not equal to…A physician wants to test if temperature has an effect on heart rate. In order to do this, she compares the heart rates in beats per minute of several random volunteers after a period of time in a room with a temperature of 50∘F and after a period of time in a room with a temperature of 75∘F. Suppose that data were collected for a random sample of 11 volunteers, where each difference is calculated by subtracting the heart rate in beats per minute in the 50∘F room from the heart rate in beats per minute in the 75∘F room. Assume that the populations are normally distributed. The physician uses the alternative hypothesis Ha:μd≠0. Suppose the test statistic t is computed as t≈5.627, which has 10 degrees of freedom. What range contains the p-value?A fast-food chain decided to carry out an experiment to assess the influence of advertising expenditure on sales. Different relative changes in advertising expenditure, compared to the previous year, were made in eight regions of the country, and resulting changes in sales levels were observed the accompanying table shows the results. Increase in advertising expenditure (%) 0 5 15 20 25 30 35 40 Increase in sales (%) 5 10 18 25 35 50 60 65 Determine the value of ∑X, ∑X2, ∑Y, ∑Y2, ∑XY. Where X represent independent variable and Y for dependent variable. Determine and interpret the coefficient of correlation between the two variables. Determine the value of regressions coefficients and write down the simple linear regression model.…