the data in the table to wer the following ques The candy maker rep ted that 33% Of the candy in the bag is red.
the data in the table to wer the following ques The candy maker rep ted that 33% Of the candy in the bag is red.

Glencoe Algebra 1, Student Edition, 9780079039897, 0079039898, 2018
18th Edition
ISBN:9780079039897
Author:Carter
Publisher:Carter
Chapter10: Statistics
Section10.6: Summarizing Categorical Data
Problem 4AGP

Related questions
Question
I need help with 5 a,b,c
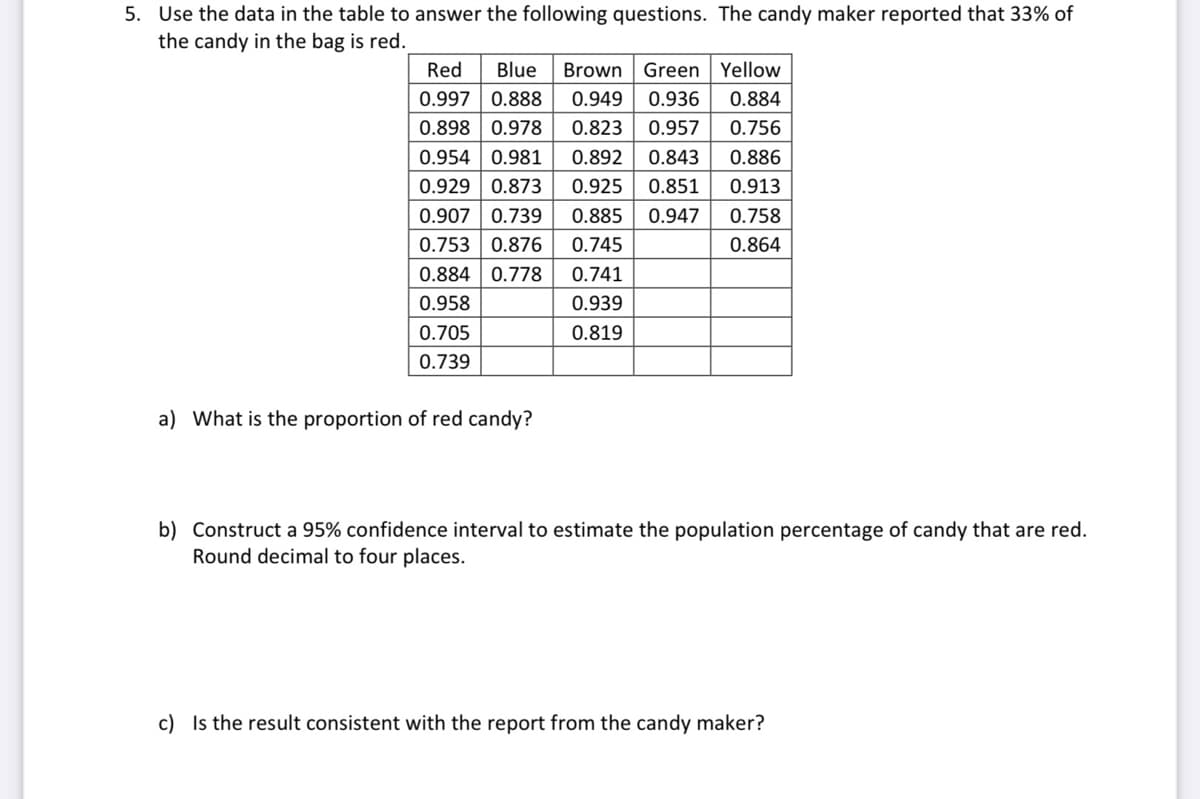
Transcribed Image Text:5. Use the data in the table to answer the following questions. The candy maker reported that 33% of
the candy in the bag is red.
Red
Blue
Brown Green Yellow
0.997 | 0.888
0.949
0.936
0.884
0.898 0.978
0.954 | 0.981
0.929 0.873
0.907 | 0.739
0.753 0.876
0.884 | 0.778
0.823
0.957
0.756
0.892
0.843
0.886
0.925
0.851
0.913
0.885
0.947
0.758
0.745
0.864
0.741
0.958
0.939
0.705
0.819
0.739
a) What is the proportion of red candy?
b) Construct a 95% confidence interval to estimate the population percentage of candy that are red.
Round decimal to four places.
c) Is the result consistent with the report from the candy maker?
Expert Solution
This question has been solved!
Explore an expertly crafted, step-by-step solution for a thorough understanding of key concepts.

Step by step
Solved in 2 steps

Knowledge Booster


Learn more about
Need a deep-dive on the concept behind this application? Look no further. Learn more about this topic, statistics and related others by exploring similar questions and additional content below.Recommended textbooks for you
Glencoe Algebra 1, Student Edition, 9780079039897…
Algebra
ISBN:
9780079039897
Author:
Carter
Publisher:
McGraw Hill
Glencoe Algebra 1, Student Edition, 9780079039897…
Algebra
ISBN:
9780079039897
Author:
Carter
Publisher:
McGraw Hill