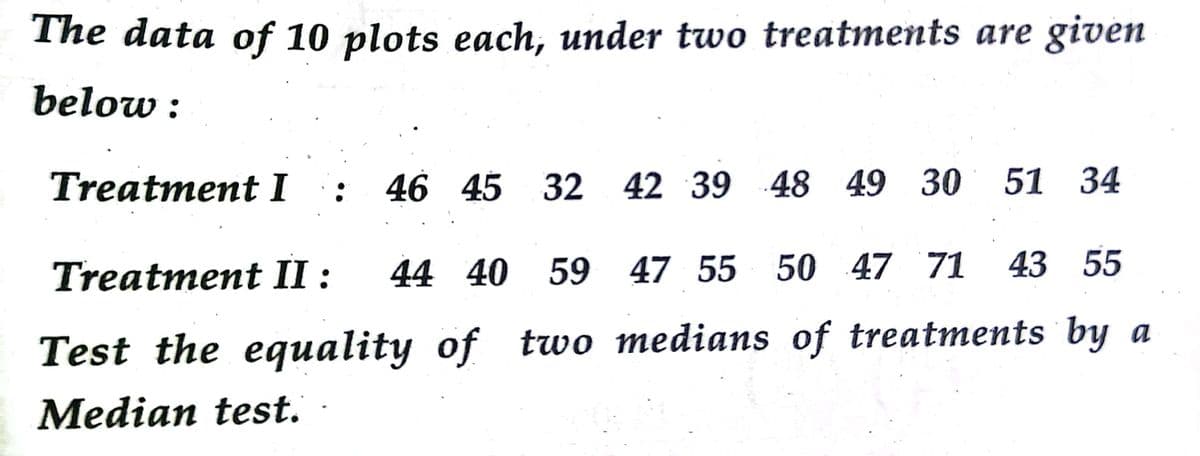
The data of 10 plots each, under two treatments are given below : Treatment I 46 45 32 42 39 48 49 30 51 34 Treatment II : 44 40 59 47 55 50 47 71 43 55 Test the equality of two medians of treatments by a Median test.
Q: For the following table, the (relative frequency) and the (midpoint) of the second class…
A:
Q: III I Compute median from the following data: Frequency Frequency 60 Mid -vulue mid-value 115 165…
A:
Q: A pediatrician wants to determine the relation that exists between a child's height, x, and head…
A: 1. Find Regression line equations from the following data X Y 28 17.6 24.75 17.2 25.75 17.2…
Q: Using the following stem & leaf plot, find the five number summary for the data. 1|0 2 2|3 44 3|1…
A:
Q: The areas of 21 certain regions, in square miles, ranges from 47 to 819 with Q1=228, median=329…
A: we have given that, The areas of 21 certain regions, in square miles, ranges from 47 to 819 with…
Q: Given the following data: 260 380 360 320 325 350 340 370 340 520 340 325 350 250 280 300 340 360…
A: The values of five number summary are : {Min, Q1, Median, Q3, Max} = {250, 300, 340, 357.5, 520}
Q: Consider the following data consisting of 9 values: Data 19 16 7 10 17 20 The minimum is The first…
A:
Q: 1 (a) The following data shows the number of goals scored by 33 teams in a season for a professional…
A: Solution We have to construct a Box and Whisker plot. So a Box and Whisker plot looks like as…
Q: Calculate Coefficient of Concurrent Deviation from the following data: X: 1 2 3 5 6. y: 25 16 5 1
A: Solution:
Q: The following data related to the distance travelled by 55 villagers to buy their weekly…
A:
Q: A survey was done at Center Hospital to determine how long (in months) clerical staff had been in…
A: Given data: 2522724263118141720314262522329321572
Q: These dot plots show the weights (in kilograms) from a sample of leopards and tigers. Leopards 20 40…
A: Given: Dot plots shows the weights in kilogram from a sample of leopards and tigers To Find:…
Q: Based on the histogram below(attached image), how are the data distributed, and where is the mean…
A: We know that if a distribution has mean < median < mode then it is called negatively skewed…
Q: Consider the following ordered data. 6 9 9 10 11 11 12 13 14 Select which a box-and-whisker plot…
A: (a) The given data is in the ascending order. The lowest data value is 6. Thus, the low data value…
Q: 6. The following data represent the times in minutes required for 18 co-workers to commute to work.…
A: WKT Stems are first digit and leafs are last digit.
Q: Consider the set of bivariate data shown in the table. X 1 4 6. y 16.5 20 23.8 23.4 22.9 22.2…
A: bivariate data is data on each of two variables, where each value of one of the variables is paired…
Q: 1. For the data set: x1: 15 16 17 18 19 20 x2:2 5 10 25 6 2 a) find the mean, median, mode, and…
A:
Q: Given the following data: 19, 11, 20, 6, 12, 5, 7, and 9. Construct a box-and-whisker plot for the…
A: Basics:
Q: The following data are the grades of 16 students on an economics test. 86 91 92 83 63 57 88 73 83…
A:
Q: Consider the set of bivariate data shown in the table. 1 3 4 5 y 5 14.5 20 23.8 23.4 24.9 24.2…
A: From the given information, The bivariate data set can be shown in the table below: x y 0 5…
Q: From the data below, plot a histogram and frequency distribution curve. Is the data normally…
A: Given data: Cell boundary Frequency 2.531 - 2.535 6 2.536 - 2.540 8 2.541 - 2.545 12…
Q: Draw (i) a Histogram and (ii) an Ogive from the following data: Daily wages (Rs.) No. of employees…
A: Let x represents the daily wages. Let f represents the number of employees. The provided data is:…
Q: The following box-and-whisker plot shows the ages of players on a neighborhood baseball team. Ages…
A:
Q: Below are the numbers of hours that a sample of 26 recent college graduates reported working last…
A:
Q: Using the following stem & leaf plot, find the five number summary for the data by hand. 1|7 8 2|1…
A: The stem and leaf plot is given as follows.
Q: A listing of calories per one ounce of selected salad dressings (not fat-free) is given below.…
A: Given that: We make a stem and leaf diagram from the given data set. Stem leaf 10…
Q: Following partial box plot was obtained for a data set. 10 20 30 40 50 60 70 80 90 a. Find the…
A: From the given partial boxplot we can see that the middle line in the box plot is at value 40 Thus,…
Q: Consider the data set below: 35,24,25,38,31,20,26,28 Which of the following box-and-whiskers plots…
A: We have a data set 35,24,25,38,31,20,26,28 Now, minimum = 20maximum=38 Arranging the data in…
Q: The following data set shows the distances a car drives (in miles) on a full tank of gas after…
A: Five number summary is, Min, Q1, Median, Q3, Max Min= 215 Sample size is n=15 First quartile, Q1=…
Q: Consider a sample of 125 insurance policies from a portfolio of a general insurance company. The…
A: We want to calculate the coefficient of skewness of the data
Q: Calculate the median of the data shown, to two decimal places x 20.1 19.9 22.3 1.2 23.9 4 3.1 1.5…
A: Arrange the values of x in ascending order: 1.2, 1.5, 3.1, 3.6, 4, 12.1, 19.9, 20.1, 22.3, 23.9.…
Q: From the following data calculate median: No. of Students Marks No. of Students Marks 29 Less than…
A:
Q: The Variance of Population for the following data :X = 155, 175, 125, 155, 175, 195, 185, 525, 255,…
A:
Q: 2. The following data are representing verbal comprehension test scores of males and females.…
A: 2. For males: The minimum test score is 17, and maximum test score is 26. The first quartile can be…
Q: The mean for the following data set {1, 2, 3, 1, 3} is:
A:
Q: Below is a box plot showing the ages of actors and actresses. Ages of Oscar Winning Actors from 1975…
A:
Q: Student grades on a chemistry exam were: 77; 78; 74; 81; 88; 51; 79; 82; 84; 91 Select the…
A: 7 stem 5 leaf means 75 or 51 means 5 stem and 1 leaf
Q: Find the median of the data using an empirical formula, when it is given that Mode= 35.3 and mean =…
A: Step 1Empirical formulaMode = 3 Median - 2 Mean
Q: Jeffery surveyed 50 randomly selected workers at a factory. He collected data about the individual…
A:
Q: For the data set: xi: 15 16 17 18 19 20 ni: 2 5 10 25 6 2 a) find the mean, median, mode, and…
A:
Q: The following table lists the number of children who attended an after-school program over an 11-day…
A: Construct a box and whisker plot for the data.20 22 29 37 49 56 64 70 70 87 92 Data in ascending…
Q: The following data are the maximum temperatures (in degrees Fahrenheit) of 17 cities in the United…
A: Arrange the given data in ascending order53 , 54,56, 59 , 61, 65, 66, 70,70, 71 ,73 , 74 , 76, 76,…
Q: 3. Show that the line of fit of the following data is given by y=-7+11-28 x 0 5 10 15 20 25 . y 12…
A: The general regression line is: y=ax+b.
Q: For the given set of data: 138 164 150 132 144 125 149 157 144 158 140 147 136 148 144 Determine:…
A: As per bartleby guideline expert have to answer first three subpart only dear student please upload…
Q: 8. The following data gives values for the fuel used to heat a house for a month, and the number of…
A: Note: Since you have posted a question with multiple subparts, we will solve the first three…
Q: Calculate inter-quartile range and its co-efficient from the following data: Wages ( $ ) 15 25 35 45…
A:
Q: The following data are the scores for 26 students on an algebra test. 71 63 92 59 55 61 48 93 56 50…
A: Solution: From the given information, box-and-whisker plot is constructed for the scores of 26…
Q: The following table presents the daily high temperatures for the city of Macon, Georgia, in degrees…
A: Given data in ascending order: 48, 48, 51, 51, 52, 52, 52, 53, 53, 53, 55, 56, 56, 57, 58, 58, 58,…
Q: What are the most likely values of r for each plot of data shown below? Figure 1 *AT THE TOP r =…
A: Correlation between two variables measure the strength and direction between two variables. It…
Q: Calculate the coefficient of concurrent deviations from the data given below 1988 Year 1985 1986…
A:
Step by step
Solved in 4 steps with 3 images